

Cassandra Monitoring: 6 Best Practices to Pay Attention To
Apache Cassandra
5 MIN READ
July 12, 2021
![]()
Apache Cassandra is an open-source distributed NoSQL database management system built to handle large chunks of data over various data centers. Cassandra was developed at Facebook to overcome its “inbox search” issue and make it easier to find the conversations. Facebook later open-sourced Cassandra, and it became an Apache Foundation project. Cassandra is a highly scalable database and is freely available under the Apache License 2.0.
Cassandra Basics and Monitoring
Cassandra is a NoSQL database built to provide better scalability and reliability. Cassandra runs on a Java Virtual Machine, and its metrics can be collected using Java Management Extensions (JMX). Databases- were built to serve various applications and need to be high performing and reliable. When a database is low-performing and unable to send and receive a request, you may experience hurdles in the working of various applications. That is why monitoring the database is such a prominent aspect of the healthy performance of a cluster. Monitoring helps in providing a vigorous environment for any database management.
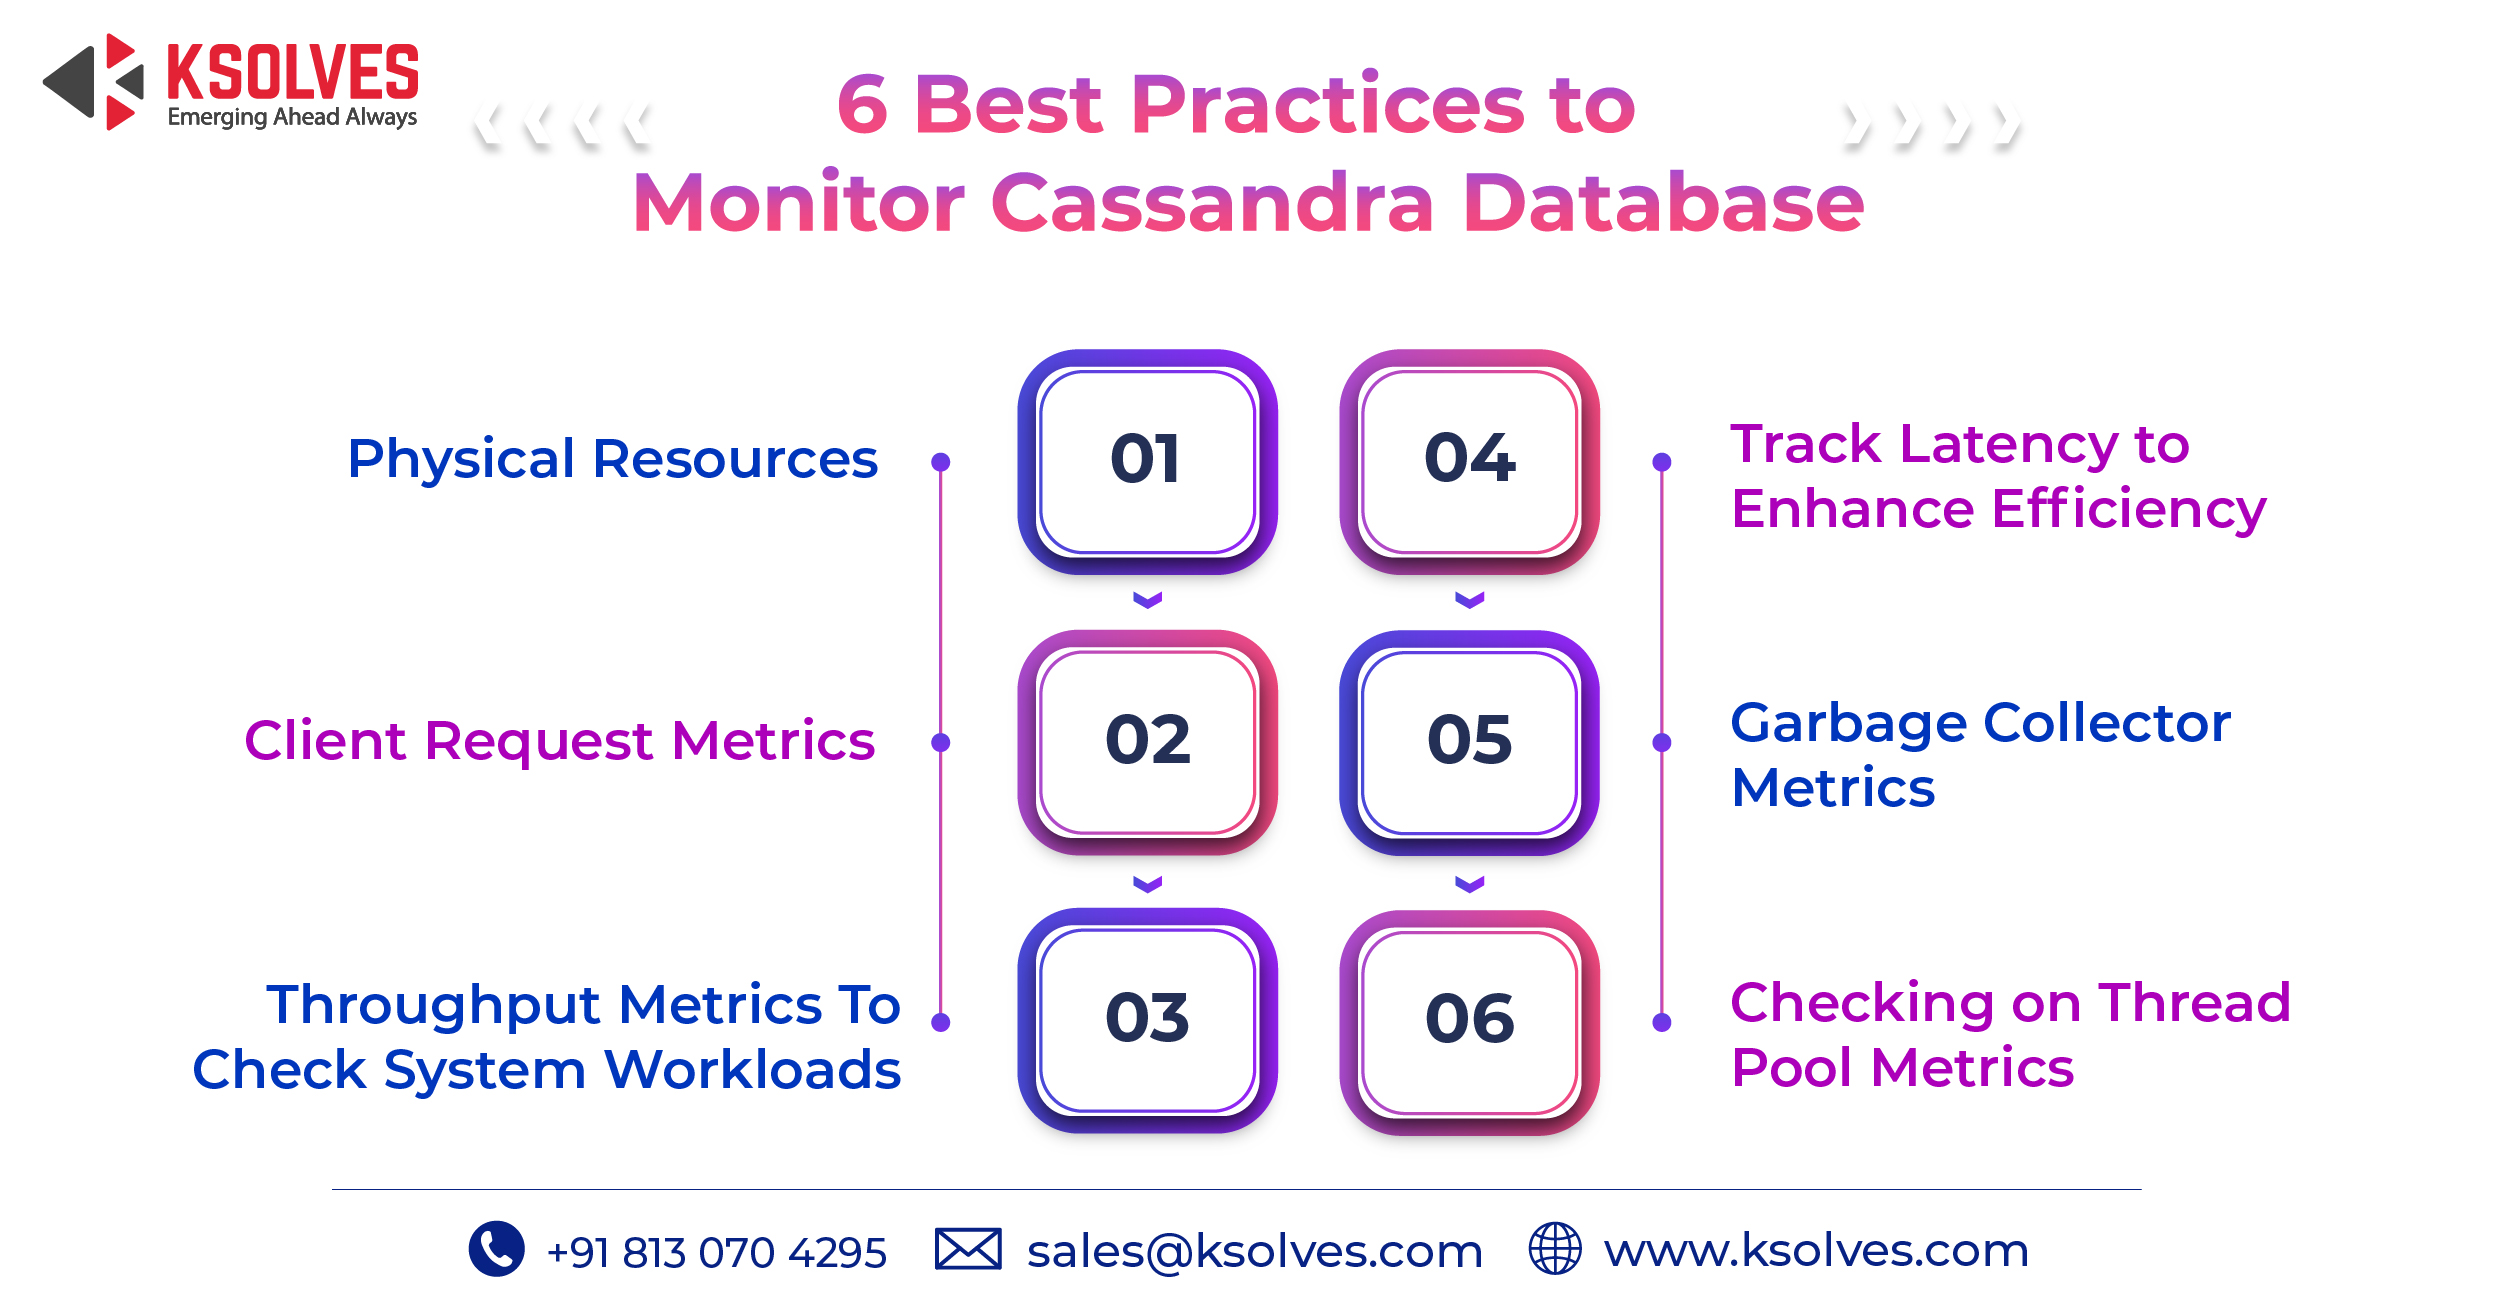
Here we will discuss the effective monitoring of Cassandra with few best practices which are going to help you with Cassandra database throughput performance.
- Physical Resources
Monitoring the physical resources is very critical for smooth database operations. CPU utilization metrics play a pivotal role in Cassandra’s monitoring. If the resources going into the cluster aren’t enough, the database will not perform efficiently. A cluster’s availability highly depends on the node status. Nodes should be in uptime since any lost performance during a node downtime cannot be retained back.
If any node is down, it should be immediately altered. If delayed, it could bring pressure on the other nodes. This alert also helps in knowing the need to repair the node. Every node that is out of the cluster for the default time of more than Three hours needs to be repaired.
- Client Request Metrics
Just like physical requests, client’s requests that are sent need to be monitored as well. Client request metrics provide information related to the communication between the client and coordinator node.
To manage these metrics we need to monitor the number of requests per second. Any cluster can efficiently handle a certain amount of requests per second, but if the request exceeds the number it results in inconsistency.
- Throughput metrics to check on system workload
Checking on throughput Metrics is one of the prominent aspects of Cassandra monitoring. It requires monitoring read and write requests and will help you with keeping tabs on requests nodes are coordinating every second.
Monitoring cache hit rate values also helps with throughput issues. The overloading which causes throughput can be reduced; by adding more nodes.
- Latency to maintain low request times
Tracking of the read and write latency by client applications is the most crucial metric of the Cassandra database. The latency monitoring tracks the speed of the read and writes requests. The main factor affecting latency is the load served by a cluster.
These metrics need to be tracked both separately and as overall values. One needs to be sure that the latency number remains low. A rise in latency number indicates the low capacity to fulfill client requests.
- Garbage collector metrics
The efficiency of Cassandra is highly dependent on the use of GC and, the GC behavior depends on the garbage collector used. Every time the java garbage collection increases, java heap memory gets resized.
Any changes in the parameters affecting the garbage collector need to be monitored thoroughly. Also setting an alert on GC pause will help with the performance of the database.
- Checking on Thread pool Metrics
Thread pool metrics provide information about the blocked tasks. It is a prominent metric when you want your Cassandra queue to keep moving. To ensure the movement: these metrics should be low or at zero.
Monitoring these pools helps in understanding the internal behavior and allows knowing about the pools under pressure due to any blocked or pending task.
Ending Note
Cassandra monitoring is as important as its implementation since it provides an insight into the system of the database and helps in improving overall performance.
Ksolves is a leading Apache Cassandra development company and provides various tools and features to support your organization. If your organizations have multiple applications running on Cassandra, we could help you to up the performance. All you have to do is connect with us.
Email : sales@ksolves.com
Call : +91 8130704295
Read related articles:
Advantages of NoSQL over RDBMS: Is the Former a Clear Winner?
Apache Cassandra Vs MySQL- What Should You Use & Why?
![]()
Frequently Asked Questions
What is Cassandra monitoring and why is it important?
Cassandra monitoring is the continuous tracking of key performance metrics – such as CPU utilization, read/write latency, throughput, garbage collection pauses, and thread pool activity – across all nodes in a Cassandra cluster. It is critical because Cassandra operates as a distributed NoSQL database where a single node failure or resource bottleneck can cascade into inconsistency, data loss, or application downtime. Without active monitoring, teams often discover performance problems only after they have already impacted users.
What happens if a Cassandra node goes down and is not repaired promptly?
When a Cassandra node is down for more than the default hinted handoff window – typically three hours – it misses writes that were held on other nodes. If the node is not repaired after it rejoins the cluster, it will return stale or inconsistent data to clients. Over time, this can lead to silent data inconsistencies and increased repair overhead, making proactive node monitoring and immediate alerting essential for cluster health.
How do you monitor read and write latency in Apache Cassandra?
Cassandra exposes read and write latency metrics through Java Management Extensions (JMX), which can be collected by tools such as Prometheus with the JMX Exporter, Grafana, or DataStax OpsCenter. Best practice is to track both 99th percentile and mean latency values separately for reads and writes, and set alerting thresholds so that rising latency is detected before it reaches the level that signals the cluster cannot fulfill client requests. Ksolves provides Cassandra support services that include real-time monitoring setup and latency tuning for production clusters.
What is the difference between throughput monitoring and latency monitoring in Cassandra?
Throughput monitoring measures the volume of read and write operations a cluster handles per second, helping teams identify whether the cluster is being overloaded. Latency monitoring, on the other hand, measures how fast individual requests are completed. A cluster can have high throughput with acceptable latency under normal load, but when throughput exceeds capacity, latency increases sharply. Monitoring both together gives a complete picture of cluster health and the right moment to scale by adding nodes.
Why do garbage collection pauses affect Cassandra performance?
Apache Cassandra runs on the Java Virtual Machine (JVM), which periodically pauses application threads to perform garbage collection (GC). During these pauses, Cassandra cannot process requests, which directly increases latency for any in-flight client reads or writes. Prolonged or frequent GC pauses indicate that heap memory is under pressure, often caused by misconfigured JVM settings or excessive object allocation. Monitoring GC pause duration and frequency – and setting alerts on them – is one of the six core Cassandra monitoring best practices.
What are Cassandra thread pool metrics and when should they raise an alert?
Cassandra uses a set of internal thread pools to handle different types of operations, such as reads, writes, compaction, and gossip. Thread pool metrics expose the number of active, pending, and blocked tasks in each pool. A blocked task count greater than zero is a warning signal that the pool is saturated and requests are being dropped or delayed. Teams should set alerts to trigger whenever blocked task counts rise above zero, as this directly indicates internal bottlenecks that degrade user-facing performance.
Who can help implement Cassandra monitoring best practices for enterprise clusters?
For teams managing large-scale or mission-critical Cassandra deployments, Ksolves offers dedicated Apache Cassandra support and development services. As a DataStax-certified team, Ksolves helps enterprises set up real-time monitoring pipelines, configure JVM and GC alerting, tune read/write latency thresholds, and implement proactive repair schedules – all tailored to the specific workload and infrastructure of each client.
Have more questions about Cassandra monitoring? Contact our team for a free consultation.

At enterprise scale, storage is never just a cost line. It is a performance variable. Every byte that does not […]


AUTHOR
Apache Cassandra
Anil Kushwaha, Technology Head at Ksolves, is an expert in Big Data. With over 11 years at Ksolves, he has been pivotal in driving innovative, high-volume data solutions with technologies like Nifi, Cassandra, Spark, Hadoop, etc. Passionate about advancing tech, he ensures smooth data warehousing for client success through tailored, cutting-edge strategies.
Share with