

A Quick Overview of Statistic for Data Science
Machine Learning
5 MIN READ
January 31, 2023
![]()
Have you ever wished for someone to simply explain the purpose of statistics and the meaning of jargon in plain English? Ksolves will do everything possible to make your wish come true! In a few minutes, we’ll quickly cover all the key statistical concepts! Or, if you stick to the large print portions, then in just one minute.

Source: https://towardsdatascience.com/essential-statistics-for-data-science-ml-4595ff07a1fa
It’s difficult enough to make decisions based on facts (parameters), but-curses! – sometimes we don’t even have the facts we need. Instead, our sample’s findings deviate from what we thought we knew (our population). That is what uncertainty entails.
The study of reasoning under uncertainty is known as statistics. What could be on your mind? a natural reaction or a pre-existing notion. What if your mind is completely empty?
Bayesians change their minds about beliefs/perceptions. . .
The school of thought known as Bayesian statistics is concerned with using facts to alter your beliefs. The preferred method of reporting results by Bayesians is to use credible intervals, which are two integers that can be understood as “I believe that our answer lives/lies between here and here.”
Hypotheses are descriptions of what the world might look like . . .
The alternative hypothesis refers to all other worlds, while the null hypothesis defines all worlds where taking the default course of action is a pleasant decision. You should modify your thinking and take alternative action if I can persuade you—with data!—that you don’t live in the null hypothesis universe.
For instance, “We can walk to class together (default action) if you typically take under 15 minutes to get ready (null hypothesis), but you can walk by yourself because I’m out of here (alternative action) if the evidence (data) suggests it takes longer.”
Testing in a nutshell: “Does the evidence make the null hypothesis look ridiculous?”
Asking whether our evidence makes the null hypothesis appear absurd is the central question in all of hypothesis testing. Rejecting the null hypothesis indicates that we have gained new knowledge and should revise our thinking. Similarly, just as going for a stroll in the woods and not seeing any humans doesn’t prove that there are no humans on the earth, failing to reject the null implies we learned nothing interesting. It simply means that we learned nothing novel regarding the existence of people. Do you find learning nothing to be depressing? It shouldn’t because you have a wonderful insurance policy and are aware of what to do in any situation. If nothing changes, you have no reason to reconsider, so carry on with your default course of action.
How can we determine if we have learned something new that is intriguing or contradictory to how we currently operate? We can look at a p-value or a confidence interval to determine the solution.
The p-value on the periodic table: it’s the element of surprise . .
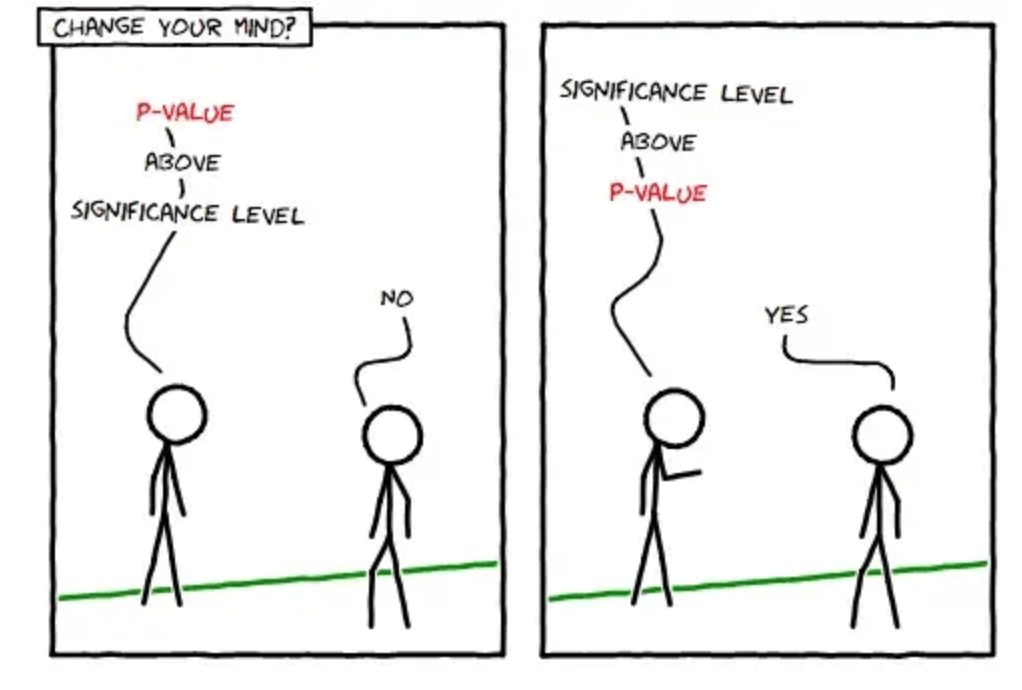
The p-value asks, “How unsurprising is my evidence if I’m living in a world where I should be adopting that default action?”
The lower the p-value, the more the data screams, “Whoa, that’s startling; maybe you should change your mind!”
Compare the p-value to a limit known as the significance level to run the test. By this knob, you can adjust how much risk you’re willing to take. Your chance of naively departing from your comfortable default action is higher. Setting the significance level to 0 indicates that you won’t make the error of using the wrong default. Pens off! Take your default action without considering any information. (However, this could lead to you foolishly NOT leaving a terrible default action.)
How to use p-values to get the outcome of your hypothesis test.
A confidence interval is simply a way to report your hypothesis test results. To use it, determine whether your null hypothesis overlaps with it or not. If it overlaps, you won’t learn anything or. If not, then you can reconsider your position.
Only change your mind/perceptions if your confidence interval doesn’t overlap with your null hypothesis. . .
A confidence interval has two important qualities that analysts find helpful in summarizing their data, despite the fact that its technical meaning is a little bit strange (I’ll explain it all in a future post; it’s definitely not straightforward like the credible interval we encountered before). The best prediction is always included, and the range gets smaller as more information becomes available. Be aware that neither it nor the p-value were intended to be easy to discuss, so don’t anticipate succinct definitions. They are only methods of summarizing test data. (This is why, if you took a class, you struggled to recall the definitions. Statisticians say: “It’s not you, it’s me.”
What is the purpose? The math ensures that if you conduct your testing in the manner I just explained, your risk of error is capped at the significance level you selected,which is why it’s crucial that you, er, choose it… If you don’t bother to choose them, then math is there to assure you the risk settings you selected (which is kind of worthless).
Uncertainty means you can come to the wrong conclusion, even if you have the best math in the world . . .
Why not statistics, then? magic that transforms ambiguity into certainty. There is no magic that can accomplish it; mistakes are still possible. Here are two errors you can make with frequentist statistics, because we’re talking about mistakes. Bayesian people don’t commit errors. Kidding! (I guess you should check out my Bayesian post.)
A Type I error occurs when you change your default action inadvertently. Hey, you claimed to be at ease with that default course of action, and now, as a result of all your calculations, you’ve abandoned it. Ouch!
Type II error is caused by incorrect default action.
Type I error is changing your mind when you shouldn’t.
Type II error is NOT changing your mind when you should.
Type II error is equivalent to failing to convict a criminal party, while Type I error is equivalent to convicting an innocent person. Unless you have more evidence (data!), in which case both errors become less likely and everything gets better, these two error probabilities are equal (making it easier to convict a guilty person likewise makes it easier to convict an innocent person). The statisticians want you to have more data because of this. When you have more data, everything gets better.
Don’t waste your time rigorously answering the wrong question. Apply statistics intelligently (and only where needed). . .
A Type III error is what? The expression alludes to accurately rejecting the incorrect null hypothesis and is something of a statistical comedy. In other words, apply all the appropriate mathematics to the incorrect question.
The emerging subject of “decision intelligence”, which examines the application of data science to addressing business challenges and making sound judgments, offers a remedy for asking and answering -incorrect questions. You may strengthen your resistance to Type III error and pointless analytics by becoming an expert in decision intelligence.
How Ksolves can Help?
At Ksolves, we are supported by a highly experienced team of professionals who are capable of resolving use cases by using statistics and probabilities before developing Machine Learning models. Do you want to get a better understanding of statistics for Machine Learning or learn how to implement ML use cases in real-time? If so, then connect with our experts today!
![]()
Frequently Asked Questions
Machine Learning is no longer a technology of the future. It is a core production capability powering fraud detection, demand […]

In recent years, machine learning (ML) has evolved from a niche technology into a vital tool across various industries. From […]

In today’s AI-powered world, data is not just fuel for machine learning, but it’s the foundation upon which intelligent systems […]


Author
About the Author Editorial Team The Ksolves Editorial Team includes certified Salesforce experts, Big Data engineers, AI/ML specialists, Zoho consultants, and experienced technology writers focused on delivering clear, actionable insights for modern businesses. With hands-on experience across Salesforce, Big Data platforms, AI/ML solutions, application development, software testing, and Zoho ERP/CRM, the team publishes practical guides, real-world use cases, and industry updates that support smarter decisions and faster growth. Every article is created to solve business challenges, guide technology adoption, and keep organizations aligned with evolving digital ecosystems.
Share with