

The 3 Crucial Roles of Dashboard in Business Intelligence 2024
Odoo
5 MIN READ
January 9, 2024
![]()
The Beginning
In the last year, we found out that dashboards in businesses are helping every organization to grow. Well, the question arises, are dashboards in business intelligence really important?
This write-up will cover the role of dashboards in business intelligence. So, keep reading to get into the details.
A dashboard represents the visual data about the company’s overall performance. The term “dashboard” is used because it works similarly to the dashboard of the vehicle.
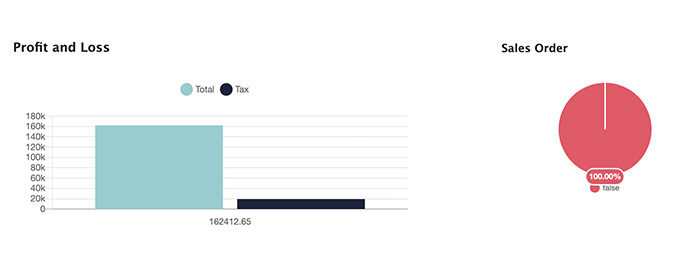
As we see details of our fuel, speed, and time on the vehicle dashboard, similarly a business can check its profit & loss using the popular Dashboard Ninja with AI tool.
The Dashboard Ninja
Dashboard Ninja with AI is an Odoo application that helps create beautiful charts. Any business can use it to view the stats of its company with the help of interactive charts (pie chart, bar chart, line chart, and more).
It is the ‘First Odoo Paid App to reach 1000 Download’ serving multiple businesses globally. You can take the FREE DEMO and convert your critical business data into engaging and easy-to-read charts.
The Role of Dashboard Ninja with AI in BI
Dashboards are the most popular and successful Business Intelligence tool because of their efficiency, usability, and performance.
The Odoo Dashboard with AI Ninja offers customization features to the user. The Managers, senior executives, or directors of the company can use the dashboard to check their business performance.
Even each employee of the company can use the Dashboard Ninja app for data analysis. With dashboards, it becomes easy to measure the KPIs (key performance indicators). Multiple data from different sources are essential for businesses that can be tracked by using graphical representations.
Additionally, Dashboard Ninja with AI goes beyond, letting you effortlessly create keyword-focused dashboard items, generate entire dashboards with AI, and easily generate individual items using AI capabilities.
3 Crucial Roles of Dashboard Ninja with AI
Here are the 3 Crucial Roles of Dashboard Ninja in Business Intelligence
-
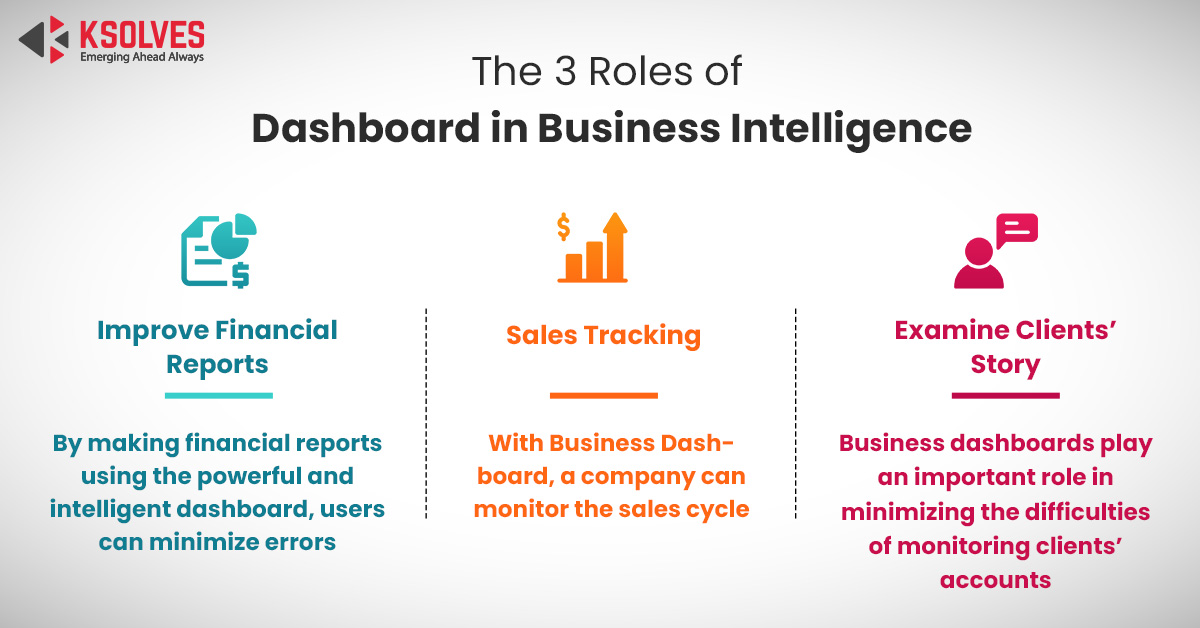
Sales Tracking
With a Business Dashboard, a company can monitor the sales cycle. One can check how many orders have been placed in the last month by using engaging charts. Customizable dashboards can help analyze the growth of the company easily.
Managers can use the sales dashboard during an important office meeting. This will have a huge impact on the co-workers, and data can be tracked easily. A user can save time in creating dozens of charts manually with the Dashboard Ninja app for Odoo.
Read More: A Wise Difference Between Odoo Dashboard and Dashboard Ninja With AI
-
Improve Financial Reports
Management of data in the finance department is complex and prone to human errors. A single-digit error in the financial report can affect the entire business. However, when you make financial reports using the powerful and intelligent dashboard, you minimize the errors.
By implementing the dashboard in business intelligence, a financial analyst can convincingly explain crucial data. Accurate data analysis leads to the best business decisions.
Show the department budget using a bar chart, pie chart, and more. Take the FREE Demo on how to create financial reports using Dashboard Ninja here!
-
Examine Clients’ Story
Business dashboards play an important role in minimizing the difficulties of monitoring clients’ accounts. Dashboards can help manage the accounts of your valuable clients with interesting graphical charts.
You can even stay updated with any updation in the client account with dashboard analysis. The Dashboard Ninja app gives you real-time data analysis. You can export the dashboard charts in PDF, Excel, Image, and CSV for your further use cases.
To download the app, visit the Ksolves Store now and get a free installation.
The Bottom Line
Many organizations fail to accurately analyze their business data. This leads to bad decision-making, misinterpretation of data, and loss of business. Use the Business Dashboard to overcome the situations of data management. Easily manage data with colorful and beautiful graphical charts.
If you have any queries or suggestions about the write-up, feel free to contact us.
As an Odoo Gold Partner with over a decade of industrial expertise, we can guide you through your Odoo needs with Odoo consulting services.
Contact Us:
Email: sales@ksolves.com
![]()
Frequently Asked Questions
What is the purpose of a dashboard in business intelligence?
Dashboards help represent critical business data in the form of engaging charts. One can create a beautiful pie chart, area chart, and more with the help of dashboards.
Who uses dashboards in the company?
Managers, Executives, Finance analysts, business analysts, and anyone in a company can use the dashboard.
With the help of Dashboards in Business Intelligence, a user can examine the important KPIs, profit & loss, and overall business performance.


AUTHOR
Odoo
Neha Negi, Presales and Business Associate Head at Ksolves is a results-driven ERP consultant with over 8 years of expertise in designing and implementing tailored ERP solutions. She has a proven track record of leading successful projects from concept to completion, driving organizational efficiency and success.
Share with