Project Name
How Ksolves Improved Multi-Location Restaurant Margins Using Real-Time Odoo Dashboards
![]()
Our client operates three restaurant locations across different regions, each serving a distinct customer segment. While revenue performance appeared strong on paper, profit margins varied significantly between locations.
The leadership team relied on static monthly reports generated from Odoo. These reports provided visibility into revenue but lacked real-time insight into food costs, labor ratios, channel performance, and location-wise profitability.
As competition intensified and costs increased, management needed operational clarity. They required a centralized, real-time view of margin drivers across all locations without adding reporting complexity.
Despite having Odoo in place, decision-making remained reactive and fragmented.
- Unknown Location Profitability: While gross revenue indicated which locations were "busy," actual profit contribution by location was unknown. Management made investment and staffing decisions based on revenue volume rather than profitability.
- Menu Managed by Guesswork: With 47 menu items, decisions about pricing, promotion, and menu composition relied on chef preferences and perceived customer demand rather than actual profit contribution data.
- Reactive Labor Management: Chronic complaints about understaffing during busy periods and obvious overstaffing during slow periods indicated scheduling problems, but without data to guide improvements.
- Delivery Platform Economics Unknown: The restaurant had embraced third-party delivery platforms to capture market share but had never analyzed whether these channels were profitable after commission fees.
- Slow Problem Detection: Operational issues, excessive food waste, portion control problems, inventory management failures, were discovered weeks or months after they began, limiting management's ability to intervene.
Ksolves implemented Dashboard Ninja with AI within Odoo to enable structured, real-time operational governance.
-
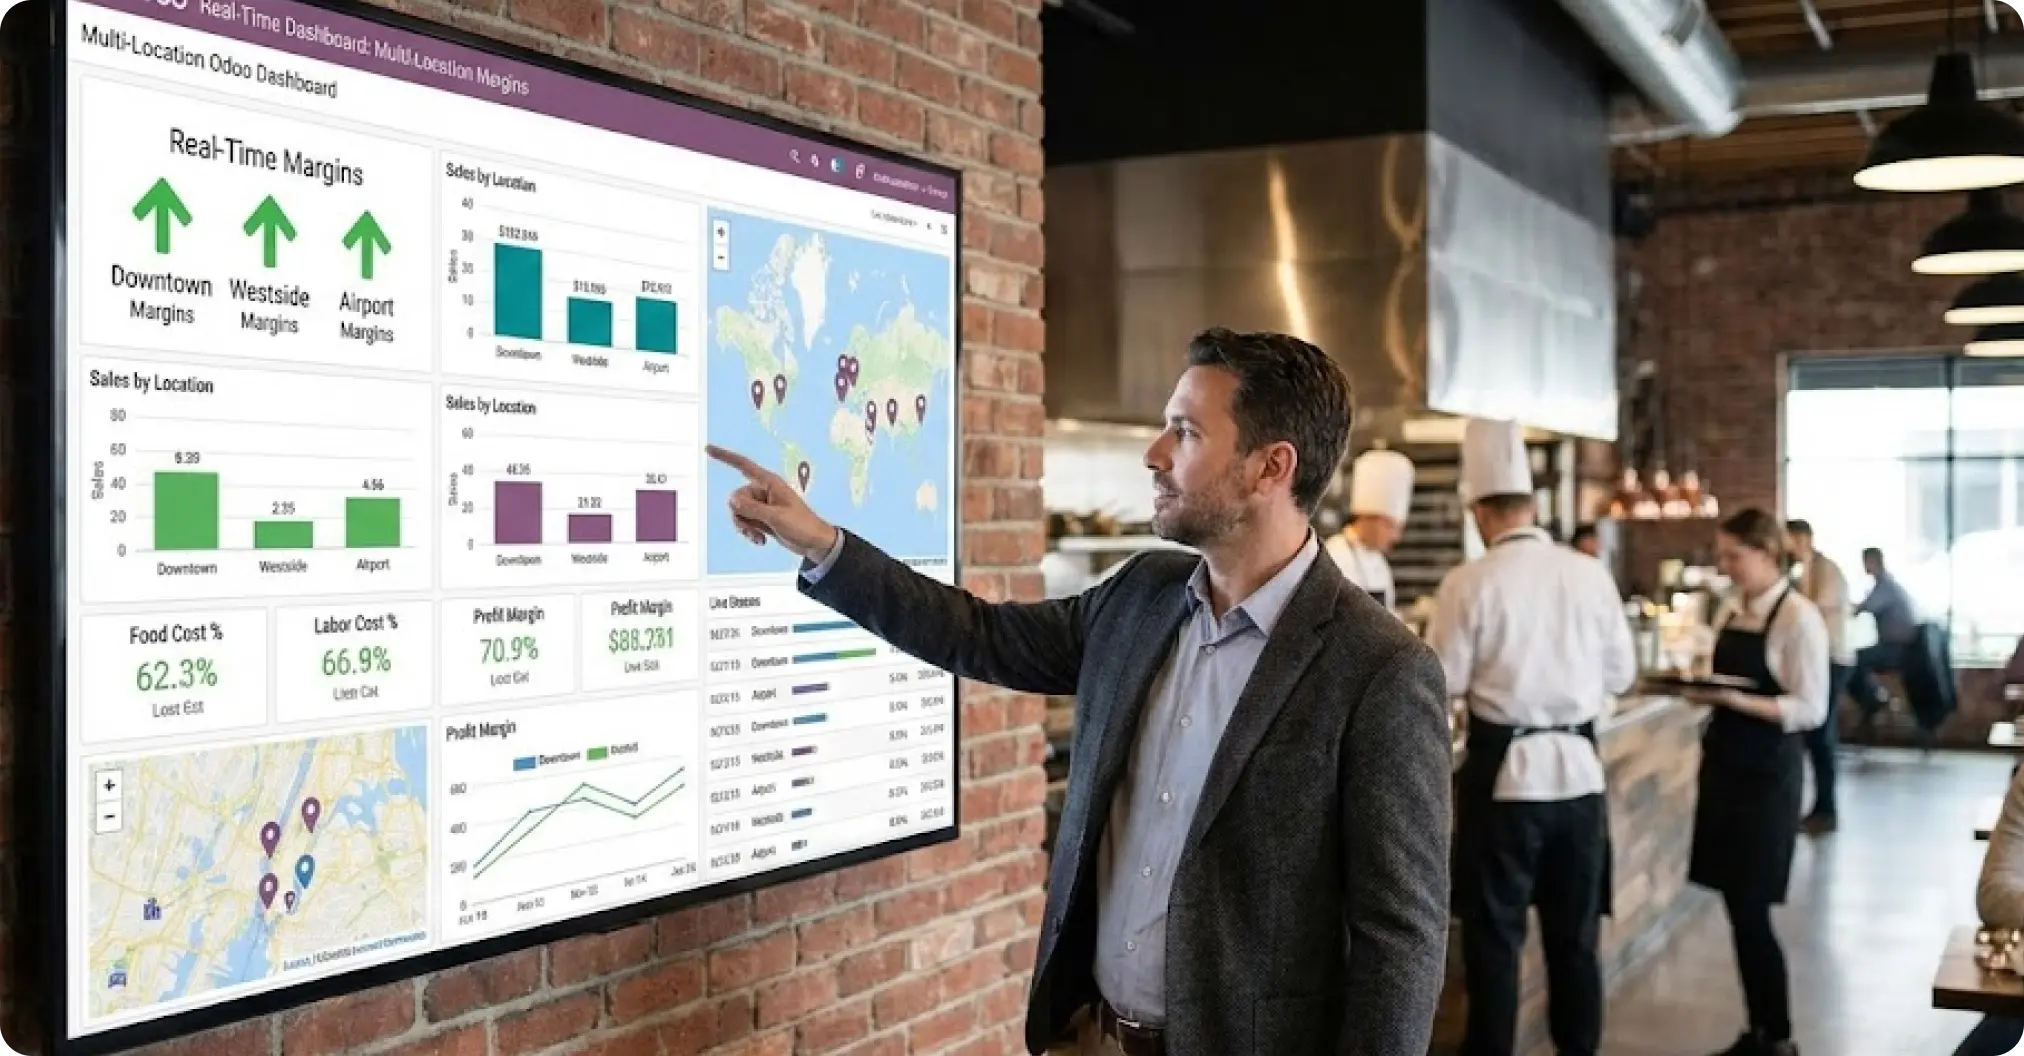
Centralized Real-Time Dashboards
Built executive-level dashboards consolidating revenue, food cost, labor cost, and net margin across all three locations. Leadership gained access to continuously updated transactional data directly from Odoo’s POS, inventory, and accounting modules, eliminating dependence on static monthly exports. -
Location-Wise Margin Monitoring
Created comparative dashboards to track performance differences between urban, suburban, and coastal outlets. Drill-down capabilities enabled managers to identify root causes quickly. -
Food Cost Control Framework
Configured daily food cost percentage tracking using automated measures and domain filters. Waste patterns and high-variance SKUs were identified early. -
Labor Optimization Insights
Configured hourly revenue aggregation using POS transaction timestamps and mapped payroll data against hourly sales trends. This allowed managers to align staffing levels with actual demand patterns instead of intuition. Managers could adjust scheduling based on actual transaction patterns. -
Channel Profitability Analysis
Configured channel-level reporting by tagging orders by source within Odoo POS and mapping third-party commissions as expense allocations in Accounting. Dashboards calculated contribution margin per channel after deducting platform commissions. -
AI-Assisted Insight Generation
Used Dashboard Ninja with AI to generate contextual chart explanations, variance summaries, and trend narratives, reducing manual interpretation effort for non-technical managers.
-
Comprehensive Data Integration
Success required standardizing data capture across Odoo POS, Inventory, and Accounting modules to ensure margin calculations reflected actual consumption, wastage, and payroll allocation. Partial data would not have revealed the full picture. -
Speed of Action
While Odoo was already implemented, the structured dashboard layer accelerated feedback cycles. Operational issues that previously surfaced in monthly reports were identified within days, shortening corrective action timelines, enabling rapid diagnosis and intervention. -
Location Manager Empowerment
Real-time dashboards gave location managers the tools to make day-to-day operational decisions without waiting for executive review, accelerating continuous improvement. -
Internal Best Practice Leverage
Rather than hiring external consultants, the company identified that one location had already solved the problems others faced, then systematically replicated those practices. -
Food Cost Stabilization
The coastal outlet reduced food cost from 48% to 32% within 12 weeks by enforcing recipe-based costing in Odoo, tracking daily variance between theoretical and actual consumption, and correcting portion control deviations identified through dashboard alerts. Company-wide food cost performance aligned with industry benchmarks. -
Improved Labor Efficiency
Approximately 80 labor hours per month were reallocated from low-demand to peak periods. This reduced idle payroll expenses while improving service levels. -
Restored Delivery Profitability
Menu rationalization and pricing adjustments converted delivery from margin erosion to positive contribution. -
Faster Decision Cycles
Managers moved from monthly reactive corrections to daily operational control. Anomalies were addressed the same day rather than weeks later.
By deploying Dashboard Ninja with AI within Odoo, our team enabled the restaurant enterprise to shift from static, retrospective reporting to continuous, live margin governance across all locations. The solution improved cost visibility, accelerated operational decision cycles, and delivered measurable improvements in food cost control and labor efficiency.
This implementation leveraged Odoo’s integrated POS, Inventory, and Accounting modules to consolidate transactional data into a unified analytical layer. Structured dashboards provided location-wise profitability tracking, channel contribution analysis, and daily variance monitoring at operational depth.
The intelligence layer was further enhanced through AI-powered chart explanations and automated variance insights within Dashboard Ninja with AI, enabling managers to interpret trends, detect anomalies, and act on cost deviations without requiring advanced analytical expertise.
Together, these capabilities established a scalable operational analytics foundation, positioning the organization to support future use cases such as predictive demand planning, dynamic pricing evaluation, and multi-location performance benchmarking.
Still waiting on month-end reports to spot what went wrong?
Let’s Build You a Real-Time View