


24/7 Prometheus Support
Keep Your Observability Stack
Running at Full Precision
We are Open source Code Contributor
 Zero-Day Vulnerability Fixes
Critical Vulnerability Assessment
Roadmap & Recommendations
SLA-Backed Technical Support
Zero-Day Vulnerability Fixes
Critical Vulnerability Assessment
Roadmap & Recommendations
SLA-Backed Technical Support
Zero-Day Vulnerability Fixes
Critical Vulnerability Assessment
Roadmap & Recommendations
SLA-Backed Technical Support
Zero-Day Vulnerability Fixes
Critical Vulnerability Assessment
Roadmap & Recommendations
SLA-Backed Technical Support
Prometheus Support That's Built to Meet the World's Strictest Data Standards


En(AI)blingTM Success for Industry Leaders


Prometheus Support Packages
Every plan is designed around a specific operational reality of your Prometheus support services needs. Choose the one that matches how critical your Prometheus environment is and how fast you need us to respond when something breaks.
Standard
Advanced
Platinum
What Ksolves Has Delivered for Organizations Running Prometheus at Scale
Across fintech, telecom, healthcare, and SaaS, enterprises running Prometheus in production trust Ksolves Prometheus commercial support to deliver stable observability, reduced alert noise, and scalable metric infrastructure.
99.99%
SLA Maintained
SLA Maintained
Ksolves holds 99.99% uptime across client environments through proactive monitoring, auto-healing pipelines, and zero-drama incident response.
40%
Lower TCO
Lower TCO
From licensing audits to compute consolidation, Ksolves cuts the total cost of ownership by 40%, without cutting corners on performance or reliability.
98%
Contract Renewal Rate
Contract Renewal Rate
We take pride in saying 98% of clients come back. Not because of lock-in, but because the work speaks for itself. That’s Ksolves Promise - on time, on budget, and exactly what was promised.
30 Min
Turnaround Time
Turnaround Time
Ksolves responds and resolves in under 30 minutes, keeping production running and teams unblocked.
Prometheus Support Services to Keep Your Full Monitoring Stack Running at Scale
From initial deployment and scrape configuration to performance tuning and 24x7 managed operations, one team handles your entire Prometheus lifecycle, delivering Prometheus enterprise support that scales with your environment from day one.
24/7 Prometheus Operations
Your dedicated Prometheus ops team monitors and manages your environment around the clock so your engineering teams stay focused on building.
- Continuous TSDB and memory health monitoring to detect degradation early
- Scrape target lifecycle management across Kubernetes, Consul, EC2, and file-based discovery
- Alertmanager maintenance covering receiver config, routing tree, and HA mesh health
- Pushgateway lifecycle management with stale metric expiry enforcement
- Retention policy tuning with TSDB compaction monitoring and WAL health checks
- Monthly health reviews covering scrape rates, rule evaluation trends, and TSDB growth

Meta-Monitoring and Full-Stack Observability
Prometheus is instrumented to monitor itself and every layer of your observability stack, covering Prometheus metrics, Prometheus network monitoring, Kafka monitoring, and Prometheus GPU monitoring with structured diagnostic reports delivered on a defined cadence.
- Grafana dashboards covering scrape duration, target availability, and Alertmanager health
- Per-job scrape failure alerting routed to Slack, PagerDuty, or OpsGenie with runbooks
- Alertmanager pipeline observability tracking notification totals, latency, and inhibition rates
- Dead-man's switch deployment to detect complete Prometheus or Alertmanager failures
- Remote write monitoring for Thanos, Grafana Mimir, and VictoriaMetrics with queue alerting
- Log aggregation via Grafana Loki or ELK Stack for cross-component root cause analysis

Root-Cause Fixes for Cardinality, Query Latency, and Memory Pressure
We fix Prometheus performance at the TSDB, PromQL, and scrape configuration layers, not at the symptom layer. Every Prometheus setup service and Prometheus configuration engagement is delivered with full documentation and validated baselines.
- Cardinality analysis using promtool tsdb analyze to identify top time series growth contributors
- Label taxonomy audit, identifying unbounded dimensions such as request IDs and session tokens
- Recording rules design to pre-compute expensive rate() and histogram_quantile() expressions
- PromQL query optimization, removing unnecessary matchers and replacing them with pre-recorded metrics
- Scrape interval tuning per target class to reduce unnecessary ingestion volume
- Prometheus sharding design for environments exceeding 10 million active time series

Production Handover, Fully Documented
Fresh Prometheus deployment or commercial APM migration delivered production-ready with runbooks included, backed by Prometheus enterprise support at every stage from architecture design through to final handover.
- Observability architecture design covering metric topology, storage selection, and Grafana structure
- Prometheus Operator deployment on Kubernetes with ServiceMonitor and PodMonitor CRDs
- Exporter deployment covering node_exporter, kube-state-metrics, blackbox_exporter, and custom exporters
- Thanos sidecar deployment for block upload, global query view, compaction, and alerting rules
- Grafana Mimir cluster deployment for multi-tenant, scalable Prometheus-compatible metric ingestion
- CI/CD pipeline for rule deployment with promtool validation and automated rollback

Zero Metric Gap Upgrades and Storage Migration
Prometheus version upgrades, Operator migrations, or APM replacements executed with full validation before cutover. Our Prometheus version upgrade and Prometheus migration service practice covers every transition path with zero metric gap delivery.
- Pre-upgrade audit covering deprecated configs, API changes, and rule syntax differences
- Rolling upgrade execution with WAL replay validation and scrape success confirmation
- Standalone to Operator migration, translating static configs to ServiceMonitor and PrometheusRule CRDs
- Historical TSDB block migration to object storage using Thanos tools or mimirtool
- VictoriaMetrics migration with remote write reconfiguration and dashboard comparison validation
- Post-upgrade benchmarking covering TSDB compaction, rule evaluation, and Alertmanager latency

Every Layer. Audit-Ready Always
Authentication, encryption, and audit logging across your entire Prometheus stack without impacting scrape or query performance.
- TLS configuration for Prometheus HTTP API and scrape endpoints with automated certificate rotation
- Bearer token and basic auth enforcement with credentials stored in Kubernetes Secrets
- OAuth2 and OIDC integration for Grafana and Alertmanager with role-assigned permissions
- Kubernetes network policies restricting Prometheus scrape access to authorised namespaces
- CVE monitoring and patch advisory for Prometheus, Alertmanager, Thanos, and all exporters
- Audit logging for query API access and config changes for SOC 2 and HIPAA evidence

Through the Client's Lens
Why Ksolves Is a Trusted Choice of Global Teams for Prometheus Support?
From cardinality explosions and alerting failures to Thanos and Grafana Mimir migrations, Ksolves is your Prometheus managed services partner with SLA-backed response and proven production expertise.

90%
Client Retention Rate

750+
Projects Successfully
Delivered

NSE & BSE
Publicly Listed
Company

600+
Workforce and still
growing

350+
Certifications

200+
Happy Clients

150K+
Support Hours
Completed
Industries We Help Scale with Prometheus
Our Prometheus consulting services USA and global delivery teams support enterprises across every major industry. As a trusted Prometheus support vendor in the USA, Ksolves tailors support around your unique ingestion volume, cardinality profile, compliance requirements, and operational demands.
Telecom
We manage Prometheus for network telemetry ingestion, CDR pipeline observability, and real-time alerting on call drop rates, packet loss, and RAN node availability across carrier-grade multi-site environments.

Healthcare
We manage HIPAA-compliant Prometheus deployments to ensure patient data pipeline health, clinical application uptime, and audit-ready metric retention, with label-level PII controls.

E-commerce
We maintain Prometheus environments monitoring checkout service latency, inventory API availability SLOs, and order pipeline throughput with alerting calibrated to peak traffic and promotional scaling.

Fintech
We manage Prometheus for transaction pipeline latency, payment gateway availability, and fraud detection response times where zero scrape gaps and complete audit trails are compliance requirements.

Entertainment
We support Prometheus deployments monitoring CDN performance, video streaming quality, and recommendation pipeline health with dynamic alerting thresholds for audience-driven traffic surges.

Manufacturing
We connect shop floor IoT sensor telemetry and MES system metrics into Prometheus via custom exporters with windowed alerting on throughput deviations and predictive maintenance thresholds.

Retail
We manage Prometheus monitoring, POS system availability, loyalty platform API response times, and customer data pipeline health across physical and digital channels in real time.

Banking and Financial Services
We support banking institutions with encrypted Prometheus deployments, per-tenant RBAC via Grafana Mimir, and audit-ready observability for regulatory reporting across multiple jurisdictions.

Logistics and Supply Chain
We manage Prometheus, covering shipment tracking API availability, warehouse management system health, and carrier integration throughput with real-time windowed aggregation dashboards.

Technology and SaaS
We manage Prometheus and Grafana Mimir deployments, providing per-tenant metric isolation, SLO-based error budget dashboards, and billing event pipeline observability across AWS, GCP, and Azure.
Ksolves: Insights from Enterprise Experts
Explore the latest real-time data processing trends, stream processing strategies, and expert insights for building scalable, reliable, and high-performance data environments.


Success Stories from Global Enterprises
Ksolves observability experts have delivered measurable outcomes for enterprises running Prometheus across industries. Explore the case studies and see the Ksolves' impact.
Prometheus and Thanos Storage Optimization
Challenge
Prometheus WAL overflows and 2,000+ stuck TSDB blocks caused repeated outages for a North American distributor.
Solution
Ksolves resolved TSDB block corruption and reconfigured Thanos compaction to eliminate disk saturation permanently.
60%
Reduction in Storage Costs

Custom Node Exporter for Prometheus
Challenge
A telecom operator needed visibility into custom metrics that the standard Prometheus Node Exporter could not capture.
Solution
Ksolves built a Python-based custom Node Exporter with real-time tracking and multi-directory monitoring.
100%
Custom Metric Coverage Achieved

Prometheus, Grafana, and Thanos Monitoring Stack
Challenge
The client had no real-time monitoring or long-term metric storage, making incident detection and analysis unreliable.
Solution
Ksolves deployed Prometheus, Grafana, and Thanos for real-time scraping, visualization, and long-term metric retention.
99.9%
Monitoring Uptime Achieved Across the Full Stack

Public Admin Access Elimination
Challenge
A SaaS platform had publicly exposed admin interfaces with no zero-trust controls in place.
Solution
Ksolves deployed OpenZiti zero-trust networking with GitOps-managed immutable appliances, eliminating all public admin exposure.
100%
Public Admin Access Eliminated

Packer Multi-Environment Image Pipeline
Challenge
Separate image builds for AWS, Azure, VMware, and Hyper-V caused configuration drift and inconsistent golden images.
Solution
Ksolves built a Packer-based pipeline producing validated golden images for all four environments from a single source.
4
Environments Unified with Zero Configuration Drift

Zero Trust Overlay Network
Challenge
A SaaS platform relied heavily on VPN access with high firewall overhead and an externalized supply chain.
Solution
Ksolves replaced VPN with an OpenZiti zero-trust overlay, internalizing the supply chain and removing all inbound firewall rules.
70%
Reduction in VPN Dependency

Prometheus and Thanos Storage Optimization
Challenge
Prometheus WAL overflows and 2,000+ stuck TSDB blocks caused repeated outages for a North American distributor.
Solution
Ksolves resolved TSDB block corruption and reconfigured Thanos compaction to eliminate disk saturation permanently.
60%
Reduction in Storage Costs
Custom Node Exporter for Prometheus
Challenge
A telecom operator needed visibility into custom metrics that the standard Prometheus Node Exporter could not capture.
Solution
Ksolves built a Python-based custom Node Exporter with real-time tracking and multi-directory monitoring.
100%
Custom Metric Coverage Achieved
Prometheus, Grafana, and Thanos Monitoring Stack
Challenge
The client had no real-time monitoring or long-term metric storage, making incident detection and analysis unreliable.
Solution
Ksolves deployed Prometheus, Grafana, and Thanos for real-time scraping, visualization, and long-term metric retention.
99.9%
Monitoring Uptime Achieved Across the Full Stack
Public Admin Access Elimination
Challenge
A SaaS platform had publicly exposed admin interfaces with no zero-trust controls in place.
Solution
Ksolves deployed OpenZiti zero-trust networking with GitOps-managed immutable appliances, eliminating all public admin exposure.
100%
Public Admin Access Eliminated
Packer Multi-Environment Image Pipeline
Challenge
Separate image builds for AWS, Azure, VMware, and Hyper-V caused configuration drift and inconsistent golden images.
Solution
Ksolves built a Packer-based pipeline producing validated golden images for all four environments from a single source.
4
Environments Unified with Zero Configuration Drift
Zero Trust Overlay Network
Challenge
A SaaS platform relied heavily on VPN access with high firewall overhead and an externalized supply chain.
Solution
Ksolves replaced VPN with an OpenZiti zero-trust overlay, internalizing the supply chain and removing all inbound firewall rules.
70%
Reduction in VPN Dependency
Frequently Asked Questions
Everything you need to know before choosing a Prometheus support partner.
Ksolves Prometheus managed services covers 24×7 server and Alertmanager monitoring, scrape target management, recording and alerting rule governance, PromQL optimisation, version upgrades, Thanos, Grafana Mimir, and VictoriaMetrics storage management, security hardening, cardinality monitoring, and root cause analysis for every critical incident.
Almost always high cardinality. Unbounded label values, such as user IDs, request IDs, or IP addresses, create excessive unique time series held in memory. Ksolves diagnoses this using promtool tsdb analyze, identifies the offending metrics, and removes or aggregates the unbounded label dimensions at the source.
Slow PromQL queries are caused by high-cardinality selectors, expensive histogram_quantile() computations, or missing recording rules. Ksolves audits the slowest queries, identifies the most expensive expressions, and implements pre-computed recording rules. Grafana dashboard load times typically drop by 60 to 85 percent.
Yes. Prometheus TSDB blocks are forward-compatible across minor versions. Ksolves performs a pre-upgrade review, executes the upgrade with a restart typically under 60 seconds, and uploads existing on-disk blocks to object storage using Thanos tools or mimirtool before any binary swap occurs.
Thanos adds sidecar block uploads and a global query view to existing Prometheus instances. Grafana Mimir is a fully scalable multi-tenant backend for very high ingestion rates. VictoriaMetrics is a cost-efficient alternative with lower resource consumption. Ksolves selects the right solution based on your ingestion rate, retention, and multi-tenancy requirements.
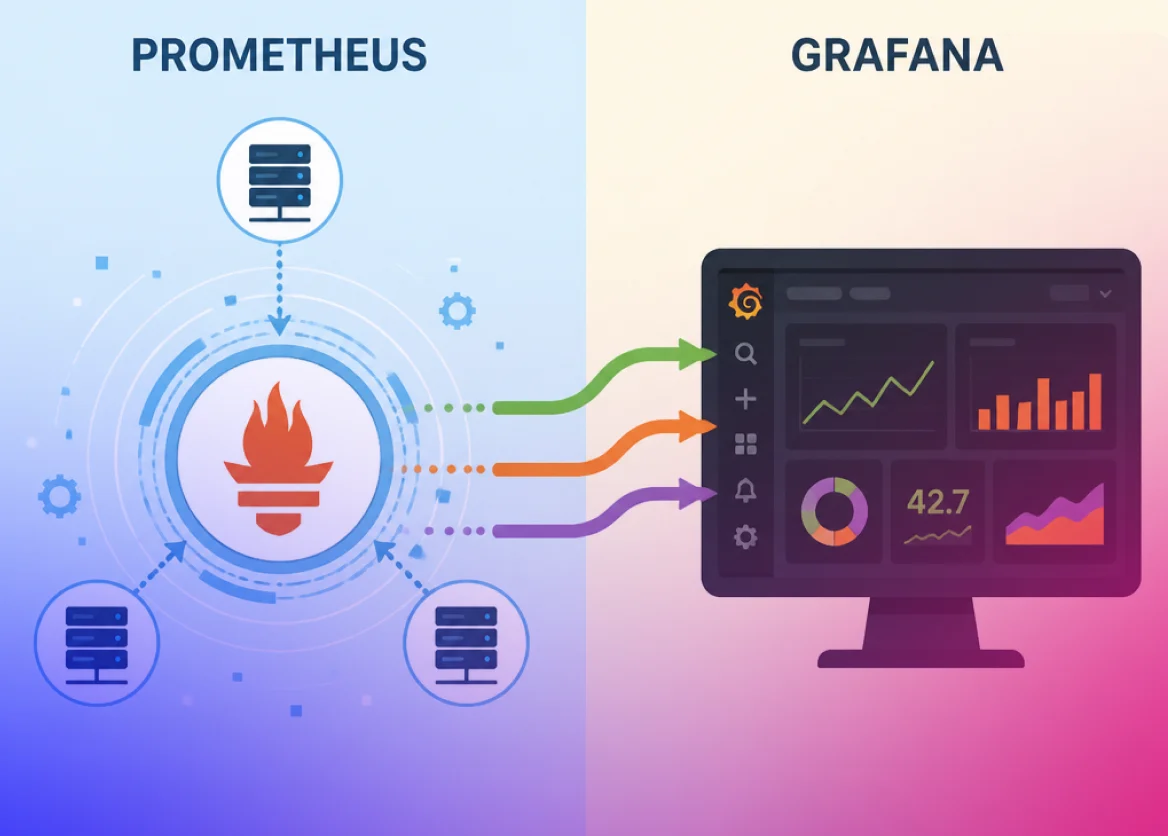
It is a common question for teams new to open-source observability. Prometheus is a time-series metrics collection and alerting system that scrapes data from instrumented targets, stores it in a local TSDB, and routes alerts via Alertmanager. It is the industry standard for Kubernetes, bare metal, and cloud observability.
The prometheus vs grafana distinction is simple: Prometheus collects, stores, and alerts on metrics. Grafana queries and visualizes them. Most production stacks use both together, with Prometheus as the data engine and Grafana as the dashboard layer.
Prometheus not scraping metrics is typically caused by network connectivity failure, incorrect scrape configuration, TLS mismatches, or targets not exposing a valid /metrics endpoint. Ksolves diagnoses and resolves scrape failures through target health inspection, firewall audit, and exporter validation.
A Prometheus high memory usage fix starts with cardinality analysis. Unbounded label values, such as user IDs or session tokens, create millions of unique time series held in memory. Ksolves runs a full cardinality audit, identifies the offending exporters, and removes or aggregates unbounded dimensions to restore a stable memory baseline.
Yes. Ksolves provides Prometheus support services across North America and Europe with US-hours and 24×7 global coverage. European clients under GDPR and PCI-DSS receive EU-region metric storage and audit logging for regulatory compliance. Critical incident SLA of 30-minute acknowledgment and 2-hour resolution applies across all geographies.


