

5 Metrics to Compare Reporting Tools Before You Buy
Odoo
5 MIN READ
July 25, 2025
![]()
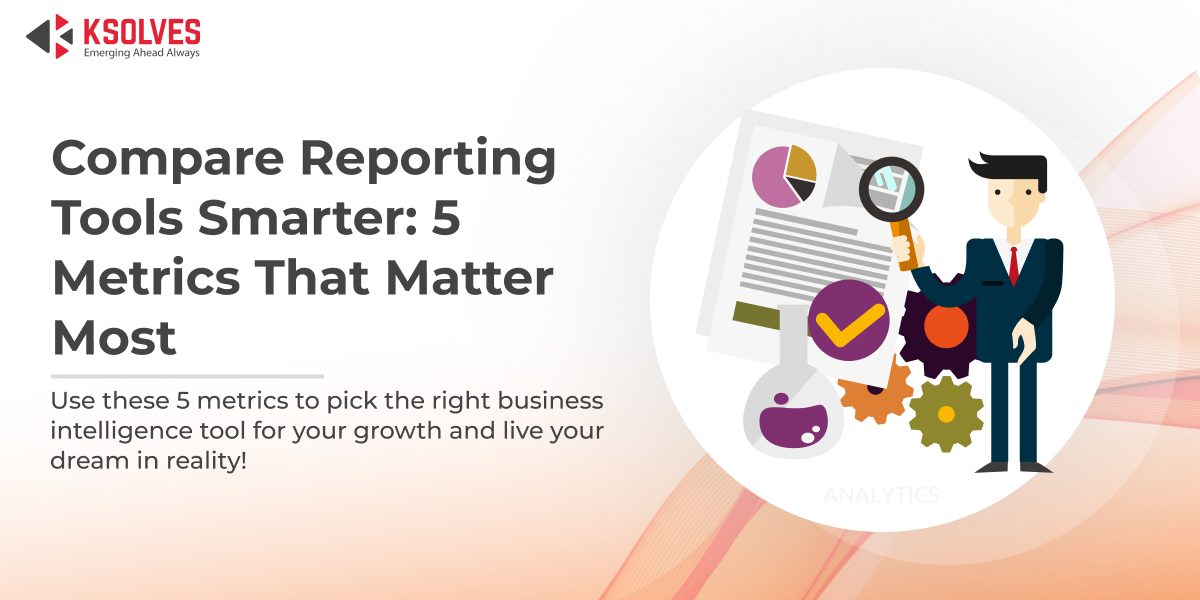
In the fast-paced, data-driven world of modern business, selecting the right reporting tool is critical to unlocking actionable insights that drive growth. With an overwhelming array of business intelligence tools, data visualization tools, and business reporting solutions on the market, making an informed choice requires a structured approach. By focusing on five key metrics, you can effectively compare reporting tools and identify the best reporting tools or top dashboard software that align with your organization’s unique needs. This blog dives into these metrics, offering practical guidance to help you make a confident decision.
1. Ease of Use and User Interface
A reporting tool’s usability can significantly impact its adoption across your team. The best reporting tools prioritize intuitive design, enabling users of all skill levels—whether executives, analysts, or non-technical staff—to create, customize, and interpret reports effortlessly. A user-friendly interface reduces training time, boosts productivity, and ensures your team can focus on insights rather than navigating complex menus. Look for tools with clean layouts, drag-and-drop functionality, and features that streamline report creation.
What to Look For:
- Drag-and-Drop Functionality: Simplifies dashboard creation without requiring coding expertise.
- Pre-Configured Templates: Ready-to-use templates for common business scenarios (e.g., sales, inventory, or financial reports).
- Mobile Responsiveness: Ensures reports and dashboards are accessible on smartphones and tablets for on-the-go decision-making.
- Guided Workflows: Step-by-step wizards or tooltips to assist new users.
- Minimal Learning Curve: Interfaces that allow users to start building reports within minutes.
A tool that balances simplicity with powerful functionality empowers your team to derive insights quickly, fostering a data-driven culture.
Read More- Top Benefits of Odoo Business Dashboard in 2025 Across Industries
2. Data Integration Capabilities
The ability to connect seamlessly with your existing systems is a cornerstone of effective business reporting solutions. A robust reporting tool should integrate with a wide range of data sources, including ERPs (like Odoo), CRMs, databases (e.g., PostgreSQL, MySQL, Oracle), cloud platforms, and even flat files like Excel or CSV. Comprehensive integration ensures your tool can aggregate real-time data from multiple sources, providing a unified view of your business performance and eliminating data silos.
What to Look For:
- Broad Data Source Support: Compatibility with ERP systems, CRMs, APIs, and flat files for versatile data access.
- Real-Time Data Syncing: Automatic updates to keep dashboards current with the latest data.
- Secure Data Handling: Encryption and compliance with data privacy standards (e.g., GDPR) to protect sensitive information.
- Data Transformation Tools: Features to clean, merge, or reformat data for accurate reporting.
A tool with strong integration capabilities ensures you can leverage all your data, making your reports both comprehensive and reliable.
3. Customization and Flexibility
Every business has distinct reporting requirements, and a one-size-fits-all approach rarely suffices. The top dashboard software offers extensive customization options to tailor dashboards and visualizations to your specific KPIs, goals, and branding. Whether you need to track sales pipelines, monitor inventory, or analyze financial performance, the tool should provide a variety of visualization types and the flexibility to create reports from scratch or adapt existing templates.
What to Look For:
- Diverse Visualization Options: Support for charts like bar, line, pie, funnel, scatter, and heatmaps to suit different data types.
- Custom Query Support: Ability to write SQL or other queries for advanced data manipulation.
- Branding Customization: Options to adjust colors, fonts, logos, and layouts to align with your company’s identity.
- Dynamic Filters and Drill-Downs: Features that allow users to interact with data and explore details on demand.
- Conditional Formatting: Highlight key metrics based on thresholds (e.g., color-coding sales targets).
A highly customizable tool ensures your reports are not only functional but also visually engaging and aligned with your business objectives.
4. Scalability and Performance
As your business grows, your reporting tool must scale to handle increasing data volumes, user demands, and complexity without sacrificing speed or reliability. Whether you’re a small startup or a large enterprise with multiple subsidiaries, business intelligence tools should deliver consistent performance. This is especially critical for organizations managing multi-company environments or processing large datasets in real time.
What to Look For:
- Multi-Company Support: Ability to aggregate and segment data across multiple business units or subsidiaries.
- High Performance with Large Datasets: Fast processing and rendering, even with millions of data points.
- Auto-Refresh Capabilities: Real-time or scheduled updates to keep dashboards current.
- Cloud and On-Premise Compatibility: Support for both deployment models to suit your infrastructure.
- Load Balancing: Efficient handling of concurrent users to maintain performance during peak usage.
A scalable tool ensures your reporting solution remains effective as your business expands, avoiding costly migrations down the line.
5. Support and Community
The quality of support and community resources can make or break your experience with a reporting tool. Even the best reporting tools require occasional troubleshooting or guidance, especially during setup or customization. A vendor with responsive support, comprehensive documentation, and an active user community can save time and reduce frustration.
Look for tools backed by dedicated support teams and resources that empower users to succeed.
What to Look For:
- Free Support Period: At least 90 days of free support for bug fixes, setup assistance, and queries.
- Comprehensive Documentation: Detailed user guides, video tutorials, and FAQs for self-help.
- Live Demos and Previews: Opportunities to test the tool before purchasing.
- Active Community: Forums or user groups where you can share tips and seek advice.
- Responsive Helpdesk: Fast, reliable support via email, phone, or live chat for urgent issues.
A strong support ecosystem ensures you can maximize the tool’s value and resolve challenges efficiently.
Why Choose Dashboard Ninja with AI?
When conducting a reporting tools comparison, Dashboard Ninja with AI by Ksolves emerged as a standout choice for Odoo users seeking top dashboard software. Built specifically for the Odoo ecosystem, it excels across all five metrics, delivering powerful, user-friendly, and scalable reporting capabilities:
- Ease of Use: Features an intuitive drag-and-drop interface,15+ pre-configured templates, and mobile-responsive dashboards, enabling users to create professional reports in minutes.
- Data Integration: Seamlessly connects with Odoo modules, external databases (PostgreSQL), and Excel/CSV files, with real-time syncing and secure data handling.
- Customization: Offers 17 visualization types (bar, pie, funnel, scatter, etc.), custom SQL query support, and branding options to create tailored, interactive dashboards.
- Scalability: Handles multi-company environments and large datasets with ease, featuring auto-refresh and compatibility with both Odoo Enterprise and Community editions.
- Support: Includes 90 days of free support, a comprehensive user guide, video tutorials, and a responsive helpdesk at sales@ksolves.com for personalized assistance.
Dashboard Ninja with AI goes beyond traditional reporting with AI-powered features, such as automated chart generation, predictive analytics, and natural language data explanations, making it a leader among data visualization tools. Whether you’re a small business or a global enterprise, it transforms complex data into actionable insights with unparalleled ease.
Ready to revolutionize your business reporting? Discover why Dashboard Ninja with AI is the ultimate choice for Odoo users. Visit the Odoo App Store to explore a live preview or contact sales@ksolves.com to schedule a personalized demo.
Take control of your data and make smarter decisions today!


AUTHOR
Odoo
Neha Negi, Presales and Business Associate Head at Ksolves is a results-driven ERP consultant with over 8 years of expertise in designing and implementing tailored ERP solutions. She has a proven track record of leading successful projects from concept to completion, driving organizational efficiency and success.
Share with