

How to Build Your First Sales Dashboard in Dashboard Ninja with AI
Odoo
5 MIN READ
September 5, 2025
![]()
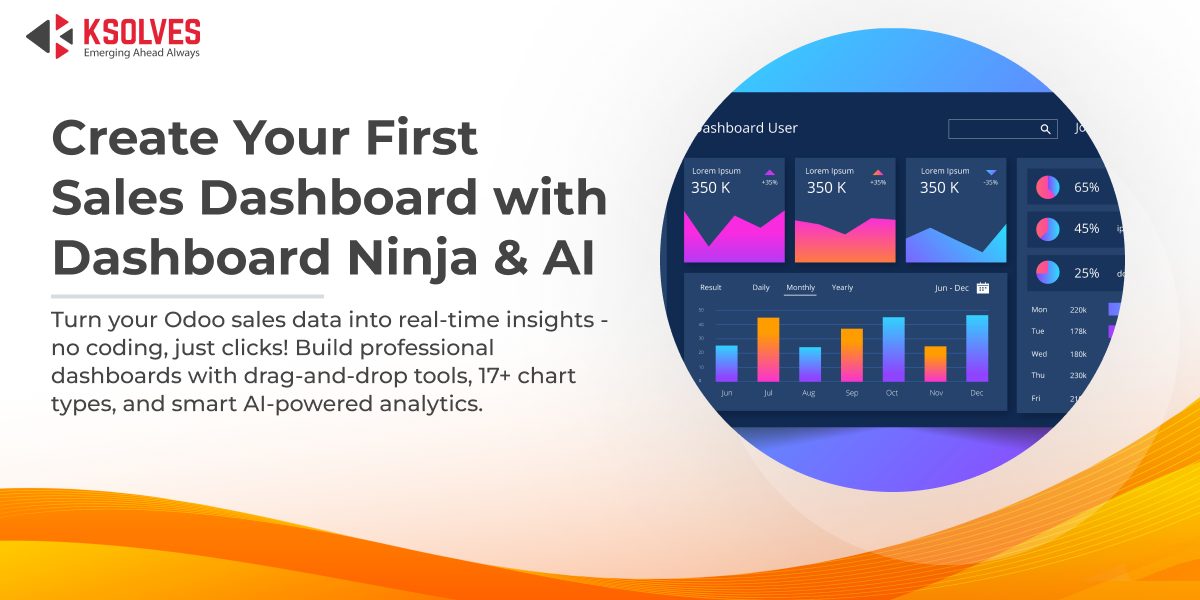
In today’s fast-paced business environment, having real-time insights into your sales performance is critical for making informed decisions. Dashboard Ninja with AI, a powerful Odoo app developed by Ksolves, simplifies the process of creating dynamic, data-driven sales dashboards. Whether you’re a sales manager tracking team performance or a business owner monitoring revenue trends, this step-by-step guide will walk you through building your first sales dashboard using Dashboard Ninja with AI. No coding skills required—just a desire to unlock the potential of your Odoo data!
Why Choose Dashboard Ninja with AI?
Dashboard Ninja with AI stands out for its intuitive drag-and-drop interface, AI-powered features, and seamless integration with Odoo modules like Sales, CRM, and Inventory. With 17 visualization types, real-time updates, and advanced customization options, it empowers users to create visually appealing dashboards tailored to their business needs. The AI capabilities allow you to generate dashboards effortlessly by specifying keywords or models, saving time and ensuring precision.
In this blog, we’ll guide you through creating a sales dashboard to track key performance indicators (KPIs) such as total sales, top-performing salespersons, and monthly trends.
See Dashboard Ninja in Action
Before diving into the steps, take a moment to see Dashboard Ninja with AI in action. This demo video from Ksolves showcases the app’s intuitive interface, AI-powered chart generation, and dynamic sales visualizations. Watch how you can create a professional sales dashboard in minutes, complete with KPI tiles, bar charts, and real-time updates.
Step 1: Install Dashboard Ninja with AI
Before you begin, ensure Dashboard Ninja with AI is installed in your Odoo environment. You can purchase and download it from the Odoo Apps Store. Follow these steps:
- Access Odoo Apps: Log in to your Odoo instance and navigate to the Apps module.
- Search for Dashboard Ninja: Type “Dashboard Ninja with AI” in the search bar and select the app.
- Install the Module: Click “Install” and wait for the process to complete. Ensure your Odoo version and Edition(Community, Enterprise) are compatible with Dashboard Ninja With AI Once installed, you’ll find Dashboard Ninja in your Odoo menu, ready to create your first dashboard.
Also Read: How to Create a Custom Dashboard in Odoo with Dashboard Ninja?
Step 2: Set Up Your Dashboard
- Access Dashboard Ninja: From the Odoo main menu, select the “Dashboard Ninja” app.
- Choose a Layout: Select from six predefined layouts or customize your own. For a sales dashboard, a grid layout works well to display multiple charts and KPIs.
- Create a New Dashboard: Click “Create” to start a new dashboard. Name it, e.g., “Sales Performance Dashboard,” and configure basic settings like menu placement and
Step 3: Add Sales Data with AI-Powered Features
Dashboard Ninja with AI streamlines the process of integrating and visualizing sales data from Odoo’s Sales module or external sources like Excel, CSV, PostgreSQL, or MySQL databases. Here’s how to add sales data accurately using AI-powered features:
1. Access the Dashboard Creation Interface:
- Navigate to the “Dashboard Ninja” app from the Odoo main menu and open your newly created dashboard (e.g., “Sales Performance Dashboard”).
- Click the “Create New Chart” button in the top-right corner of the dashboard screen to start adding a new dashboard item.
2. Select the Dashboard Item Type:
- A pop-up window will appear, prompting you to choose from 17 available dashboard item types (e.g., Bar Chart, Line Chart, Pie Chart, etc.).
- For sales data, select an appropriate type, such as a Bar Chart for total sales by customer or a Line Chart for monthly sales trends.
3. Choose the Sales Model:
- In the dashboard item creation window, select the “Sale Order” model from the “Model” field (mandatory). This pulls sales-related data such as total revenue, customer names, or order dates.
- After selecting the model, click the “Edit Domain” button to define specific filters. For example, you can set a domain like “Sale Order where the total amount is greater than 100” to focus on high-value orders.
4. Use AI to Generate Dashboard Items:
- In the “Create Dashboard with AI” option, select the “Sale Order” model or input keywords like “Total sales by customer” or “Monthly sales trends” in the AI input field.
- Dashboard Ninja supports 15 pre-defined keywords for AI-driven item generation, or you can enter custom keywords. The AI will analyze the table structure and generate a relevant chart (e.g., a bar chart for total sales or a line chart for trends) within seconds.
5. Customize Data Fields and Filters:
- Under the “Data” tab, select measures (e.g., “Amount Total” for revenue) and group by fields (e.g., “Salesperson” or “Order Date”). The measures support integer or monetary fields, while group-by fields support most types except many2many, one2many, and binary fields.
- Apply filters like date ranges (e.g., “Last 30 Days” or “Last Quarter”) or sales teams to refine the data. For instance, to track the top 10 salespeople, group by “Salesperson,” set the “Record Limit” to 10, and select a measure like “Amount Total” with a data type of “Sum.”
- If grouping by a date field (e.g., “Order Date”), use the “Group By Date” option to aggregate data by day, week, month, quarter, or year.
6. Configure Display Settings:
- Under the “Display” tab, customize the chart’s appearance by selecting a color palette (Default, Cool, Warm, or Neon), font styles, or icons.
- Optionally, enable the “Stacked Bar Chart” option for bar charts to display data in a stacked format, or configure other visual settings to align with your brand.
Example: To create a bar chart showing total sales by the top 10 salespeople, select the “Sale Order” model, group by “Salesperson,” set the measure as “Amount Total” (Sum), and limit to 10 records. The AI can generate this chart automatically based on the keyword “Top salespeople sales.”
Step 4: Design Your Dashboard
Now that you have your data, it’s time to make your dashboard visually appealing and functional:
- Add Visualization Types: Choose from 17 chart types, such as Pie Charts, Line Charts, or Funnel Charts, to represent your data. For sales, a Pie Chart for customer distribution or a Line Chart for monthly sales trends works well.
- Drag and Drop Items: Use the drag-and-drop interface to arrange charts, tiles, or KPIs on your dashboard. Resize items by clicking the resize icon at the bottom-right corner of each element.
- Apply Themes and Colors: Select from four color themes or use the color palette to match your brand. Add icons or background colors to highlight key metrics like total revenue.
- Enable Interactivity: Add drill-down functionality to explore detailed data. For instance, clicking a bar in a sales chart can display individual customer orders.
Step 5: Apply Filters and Real-Time Updates
To make your dashboard dynamic:
- Add Filters: Use predefined filters (e.g., “Last 7 Days”) or custom filters to focus on specific data, such as sales by region or product category.
- Enable Live Updates: Use the “Auto Update feature”to ensure your dashboard reflects updates in regular intervals from the Sales module without manual refreshes.
- Set Up Drill-Downs: Allow users to click on a chart (e.g., a monthly sales bar) to view detailed data, such as individual orders for that month.
Also Read: How to Create Stunning Dashboards with Dashboard Ninja: A Step-by-Step Guide
Step 6: Review and Share Your Dashboard
Before sharing, review your dashboard for accuracy:
- Check Data Consistency: Ensure all charts display the correct data by cross-referencing with your Odoo Sales module.
- Test Interactivity: Click through filters and drill-downs to confirm they work as expected.
- Export or Share: Export your dashboard as a PDF, Excel, CSV, or PNG for presentations, or share it via email. You can also set role-based access controls to restrict visibility to authorized team members.
Step 7: Leverage AI for Insights
Dashboard Ninja with AI goes beyond visualization by providing actionable insights:
- AI-Powered Insights: Use the AI to identify trends, anomalies, or predictions. For example, it might highlight a sudden spike in sales for a specific product, prompting further investigation.
- Switch Chart Types: Experiment with different visualizations (e.g., switch from a bar to a pie chart) to find the most insightful representation of your data.
- Bookmark Key Dashboards: Save your sales dashboard for quick access using the Bookmark Dashboard feature.
Example: A Sample Sales Dashboard
Here’s what your first sales dashboard might include:
- KPI Tile: Total revenue for the current quarter.
- Bar Chart: Top 10 salespeople by sales volume.
- Line Chart: Monthly sales trends over the past year.
- Pie Chart: Sales distribution by product category.
Each element can be customized with filters (e.g., by region or team) and drill-downs to explore underlying data.
Tips for Success
- Start Simple: Focus on 3–5 key metrics to avoid overwhelming users.
- Use Responsive Design: Ensure your dashboard is mobile-friendly for on-the-go access.
- Regularly Update: Use AI-driven insights to refine your dashboard as business needs evolve.
- Collaborate: Share your dashboard with your team and use role-based access to maintain data security.
Conclusion
Building your first sales dashboard with Dashboard Ninja with AI is a straightforward process that transforms raw Odoo data into actionable insights. With its AI-powered features, intuitive interface, and extensive customization options, you can create a professional, real-time dashboard in minutes. Whether you’re tracking sales performance, identifying trends, or sharing insights with your team, Dashboard Ninja with AI empowers you to make data-driven decisions with ease.
Ready to get started? Install Dashboard Ninja with AI from the Odoo Apps Store and explore its features today. For support, contact the Ksolves team at sales@ksolves.com or odoo.helpdesk@ksolves.in.
Happy dashboarding, and take your sales performance to new heights with Dashboard Ninja with AI!
Frequently Asked Questions
Do I need coding skills to use Dashboard Ninja with AI?
No, the app is designed for business users and requires no coding skills. Its intuitive interface and AI features simplify the entire dashboard creation process.
Which Odoo modules can I integrate with the dashboard?
Dashboard Ninja with AI seamlessly integrates with Odoo modules like Sales, CRM, and Inventory. It also supports external data sources such as Excel, CSV, PostgreSQL, and MySQL.
How does the AI feature assist in dashboard creation?
The AI capabilities allow users to generate dashboard items effortlessly by inputting keywords (e.g., “Total sales by customer”) or selecting models. The AI analyzes the data structure and instantly generates a relevant visualization, saving time and ensuring precision.
How many visualization types are available?
The application offers 17 different visualization types, including Bar Charts, Line Charts, Pie Charts, Funnel Charts, and KPI Tiles, to represent your data effectively.
Can I filter the data on the dashboard?
Yes, you can apply predefined filters (like “Last 30 Days”), custom filters, and enable real-time auto-updates to ensure your dashboard reflects the most current data from your Odoo Sales module.


AUTHOR
Odoo
Neha Negi, Presales and Business Associate Head at Ksolves is a results-driven ERP consultant with over 8 years of expertise in designing and implementing tailored ERP solutions. She has a proven track record of leading successful projects from concept to completion, driving organizational efficiency and success.
Share with