
Kafka Challenges & How Experts Solve Them
EXECUTIVE SUMMARY
Purpose
This guide is written for engineering leaders and data engineering teams responsible for Apache Kafka deployments in production environments. It documents six failure patterns that account for the majority of Kafka production incidents, explains the technical mechanism behind each, and describes the approaches that experienced Kafka specialists use to resolve and prevent them.
Background
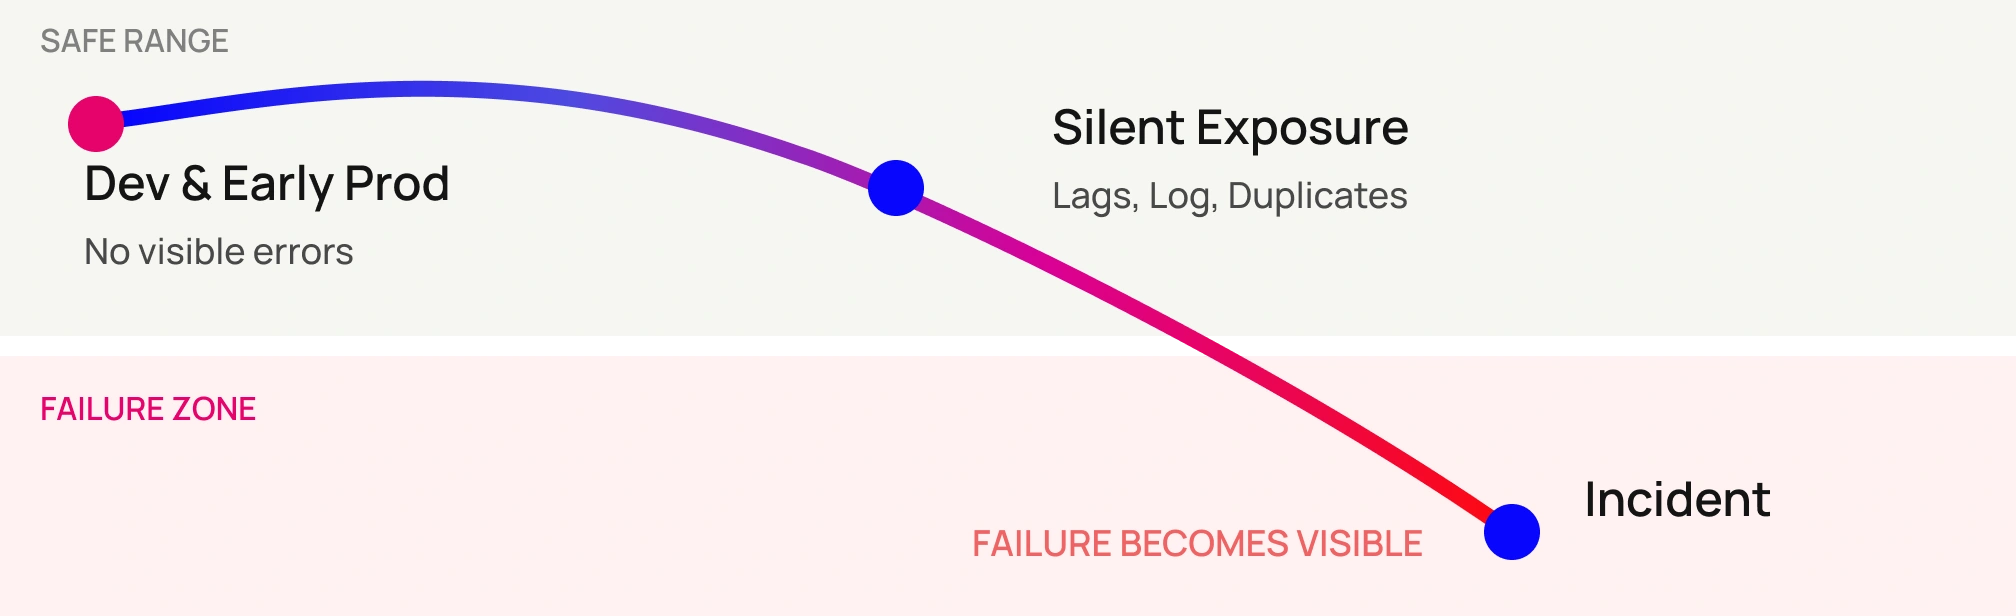
Apache Kafka’s default configuration is optimized for throughput. Durability, schema safety, load distribution, and operational observability require deliberate configuration decisions that the defaults do not make. Teams that deploy Kafka without addressing these areas typically operate within a safe range during development and early production, then encounter failures as traffic scales, team size grows, or deployment complexity increases.
The Six Challenges
- 01 Consumer lag & throughput ceilings Throughput
Under-partitioned topics and blocking loops create ceilings adding consumers cannot fix.
- 02 Data loss & the durability trap Data loss
Leader-only acks and auto-commit expose deployments to unrecoverable message loss.
- 03 Schema compatibility failures Data integrity
Unmanaged schema changes corrupt downstream systems without error logs or alerts.
- 04 Partition imbalance & hot partitions Scalability
Skewed partition keys concentrate traffic on a subset of brokers, capacity cannot resolve this.
- 05 Duplicate message processing Correctness
At-least-once semantics plus retry behavior produce duplicates without explicit deduplication.
- 06 Operational debt Operations
Deferred monitoring, unmanaged security defaults, and misunderstood scaling create compounding risk.
Understanding the Production Gap
Apache Kafka has become the default infrastructure for real-time data at scale, handling high-throughput event streams across financial services, healthcare, e-commerce, and logistics. When configured and operated correctly, it is one of the most reliable distributed systems available. However, Kafka’s defaults are optimized for throughput, not durability. Acknowledgment behavior, offset management, schema validation, and observability all require explicit configuration decisions the defaults do not make.
A cluster can operate without errors while silently losing data, producing duplicates, or accumulating structural imbalances that only surface under production load. Teams that defer these decisions do not encounter failures immediately; the degradation is gradual, and the exposure typically becomes visible only when an incident forces it.
| “The conditions that cause Kafka incidents in production are almost always present before the incident occurs. Identifying them systematically is the difference between proactive engineering and reactive firefighting.” |
What this guide covers
Six failure patterns that account for the majority of Kafka production incidents across industries.
What you’ll learn
The technical root cause, business impact, and resolution approaches used by experienced Kafka teams.
Who benefits most
Organizations that recognize these patterns in their current environment before an incident forces the conversation.

Challenge #1: Consumer Lag
When adding more consumers does not help
How partition design and processing architecture determine pipeline throughput
Key symptom
Lag accumulates steadily over several hours. Consumer instances are running and appear healthy. No exceptions in application logs, no alerts have fired. Downstream analytics silently reflect data that is significantly out of date, investigation reveals not a system failure, but a system never designed to sustain production throughput at current scale.
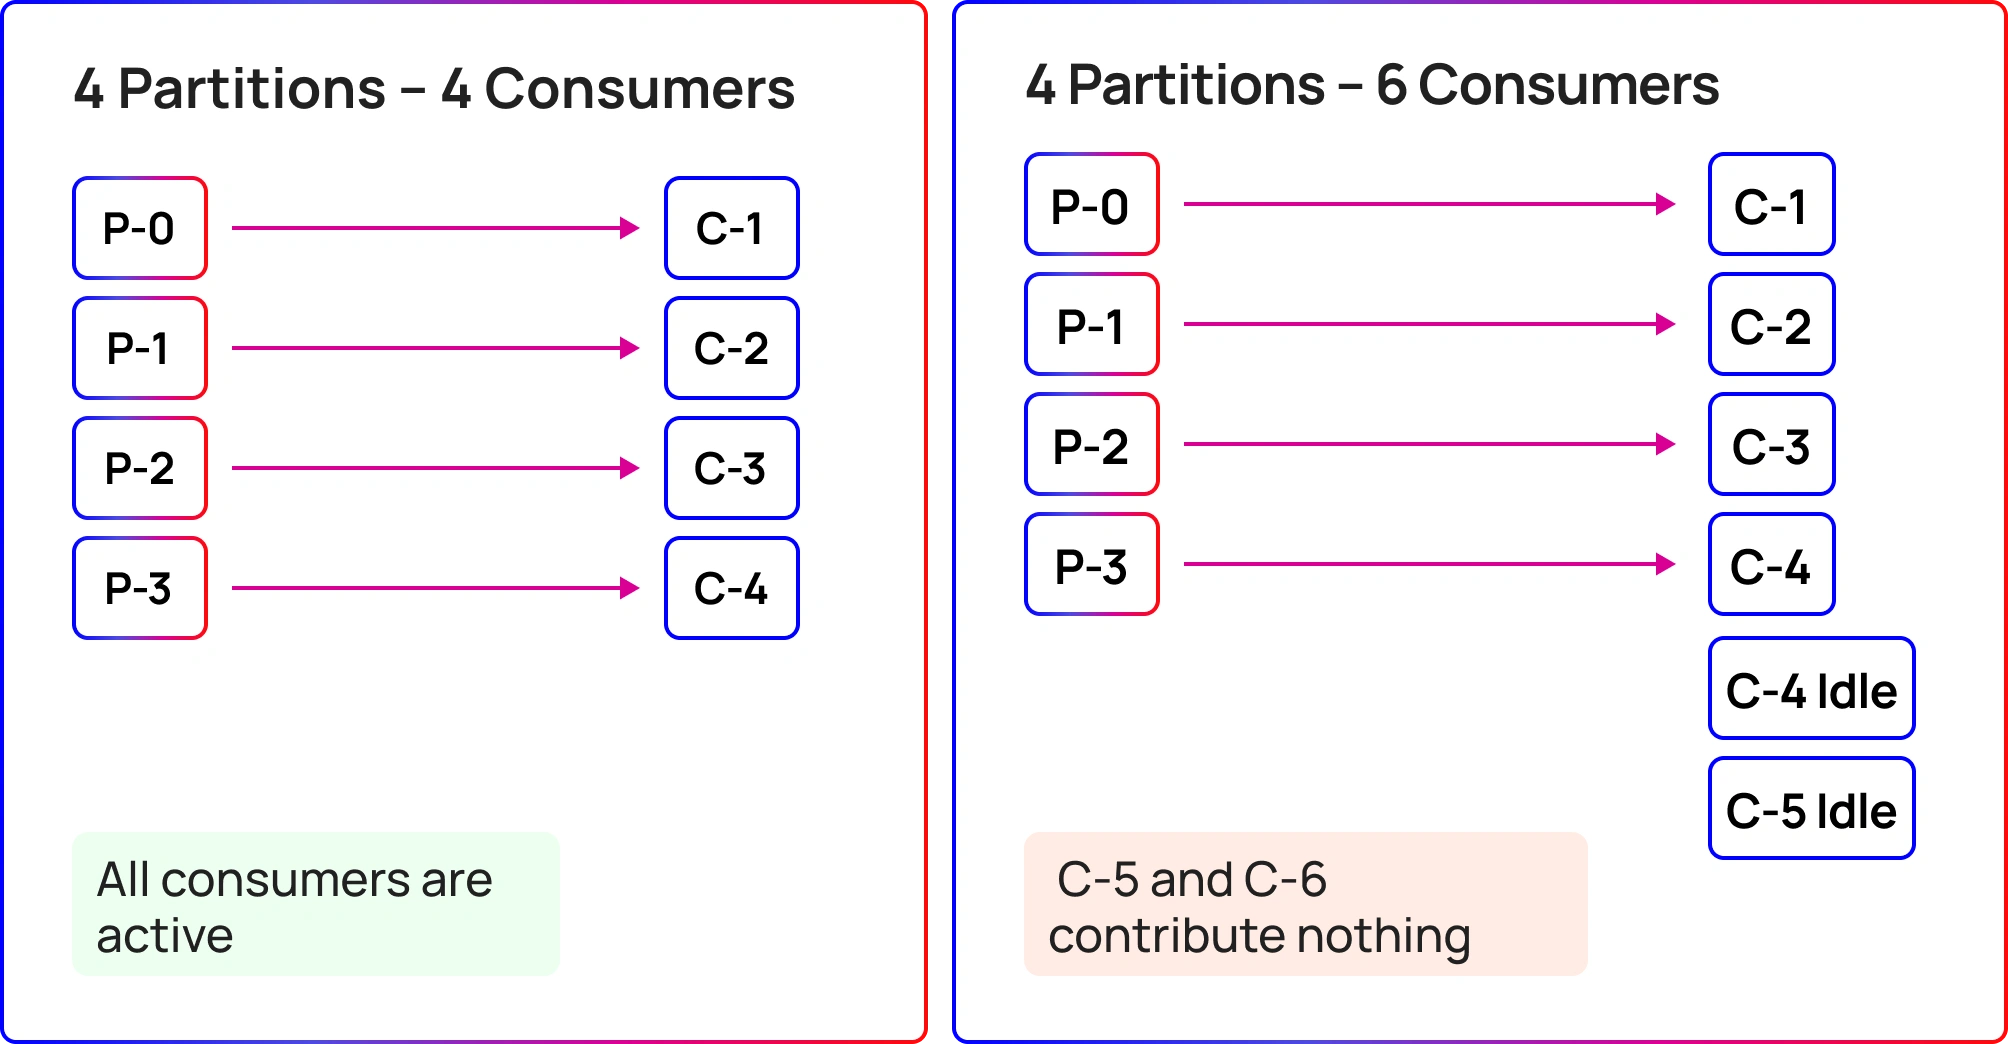
Partition ceiling: Why scaling out fails
Hard ceiling
Partitions cap parallelism. No number of additional consumers changes this until partition count is raised.
Irreversible decision
Partition count cannot be reduced after topic creation, only increased. Every initial deployment sets a long-lived architectural constraint.
Root causes
- Poll loop blocking
Synchronous database writes or external API calls inside the poll loop inflate max.poll.interval.ms. Once it exceeds the 5-minute default, the broker declares the consumer failed and triggers a full group rebalance, halting all consumption across every instance.
- Rebalance amplification
A rebalance halts all message processing across every consumer in the group, not only the instance that triggered it. Auto-scaling, container restarts, and network instability each generate rebalance events, compounding throughput loss across the entire pipeline.
Business impact, rebalance cascade, and resolution approaches
Rebalance cascade: How one consumer halts the entire group
- Poll timeout
Blocking op exceeds max.poll.interval.ms
- Consumer evicted
Broker marks instance as failed
- Group halted
All consumers stop processing, not just the failing one
- Full rebalance
Partitions reassigned across all group members
Auto-scaling events, container restarts, and network instability each independently trigger this cascade. In environments with frequent deployments, rebalances can become the primary constraint on effective throughput.
Business impact
Fraud detection
Systems operating hours behind real-time cannot prevent active fraud, only report it after the fact.
Inventory systems
Fulfillment commitments are generated against stock positions that no longer reflect reality.
Financial dashboards
Decisions are made on stale data with no visible signal that the underlying feed is lagging.
What expert teams do
- Audit partition counts against actual peak throughput numbers, not estimates or historical averages, before recommending changes.
- Separate message receipt from processing, eliminate all blocking operations from the poll loop entirely using async or thread-pool patterns.
- Implement static group membership so container restarts and auto-scaling events do not trigger full group rebalances.
- Use directional lag alerting; teams need to know when lag is actively growing, not just when it has crossed a static threshold.
- Benchmark under realistic load to validate that throughput targets can be sustained continuously, not just achieved at peak momentarily.
Challenge #2: Silent Data Loss
When Kafka confirms a message it cannot recover
How default acknowledgment settings expose production data to permanent loss
Key Symptom
After a routine broker restart, reconciliation flags a gap. Records that producers logged as successfully sent do not appear in the downstream database. They are not delayed. They do not appear later. They are permanently absent from the system.
“Confirmed messages that were never actually safe.”
This is what Kafka’s default configuration makes possible.
Acknowledgment modes: Default vs Safe
| ACKS=1 · DEFAULT · UNSAFE | ACKS=ALL · SAFE |
| Producer→Leader writes→✓ ACK
Follower✗ not yet replicated Leader crashes Producer holds a delivery confirmation. The data does not exist anywhere in the cluster. It is permanently lost. |
Producer→Leader writes
Follower 1 ✓Follower 2 ✓ ✓ ACK only after all replicas written Leader can crash. Message survives. Any follower elected as leader holds a complete, confirmed copy. |
Root causes
- Producer-side gap
acks=1 confirms receipt the moment the leader writes locally, before any follower replicates. A leader failure before replication completes permanently destroys the message, while the producer believes delivery succeeded.
- Consumer-side gap
Automatic offset committing advances the consumer’s position on a fixed timer, independent of whether processing has completed. A crash after the offset commits but before the message is written to its destination means Kafka will never redeliver it.
| Default behavior
Maximum throughput |
in direct tension with | Production requirement
Data durability |
Offset management failure, business impact and resolution approaches
The auto-commit trap: How offsets cause silent loss
- Message polled
Consumer receives message from broker
- Timer fires
Auto-commit advances offset; processing not yet done
- Consumer crashes
Before message reaches destination
- Data gone forever
Kafka marks it delivered. No redelivery. No trace.
Kafka considers the message delivered the moment the offset commits, not when the downstream system confirms it. The two events are decoupled by default, and that gap is where data disappears.
Business impact
- Regulated industries
In banking, healthcare, and insurance, undiscovered data loss can constitute a compliance failure, even when the producer application completed without errors.
- E-commerce
Orders never processed, payments captured but not applied, inventory decremented without a corresponding fulfillment record, all silent, all unrecoverable.
- Discovery lag
Loss is often found hours, days, or weeks later via reconciliation or a business user noticing a gap, long after recovery becomes impossible.
- No visible signal
The producer logs success. The application moves forward. There are no exceptions, no alerts, no retries. The system behaves as if nothing went wrong.
What expert teams do
- Audit every topic’s durability configuration and classify topics by data criticality before making any recommendations.
- Implement full replication acknowledgment so messages are only confirmed after a minimum number of replicas have written them, not just the leader.
- Disable unclean leader elections, which sacrifice data integrity for availability during broker failures.
- Redesign consumer offset management so offsets advance only after processing is verifiably complete, never on a timer ahead of confirmation.
- Establish a Dead Letter Queue infrastructure so messages that cannot be processed are captured and examined, not silently dropped.
Challenge #3: Schema Compatibility
When producer changes break consumer systems silently
How unmanaged schema changes corrupt downstream systems without generating errors
Key symptom: The real incident
A developer renames a field: productTitle becomes title. The change passes unit tests and deploys to production. Within hours, the search indexing service silently stops updating product names. Every new product has a null title in the index. No exception thrown. No alert fired. Discovered only by a user searching for a product added that afternoon.
What the schema change looks like, and why it breaks everything
| Before — producer v1
“productId”: “p-001”, “productTitle”: “Air Max”, “price”: 129.99, “category”: “footwear” |
After — producer v2
“productId”: “p-001”, “title”: “Air Max”, “price”: 129.99, “category”: “footwear” |
| Consumer still reads productTitle – the field no longer exists. It receives null. No exception. No warning. It writes null into the search index, the database, and the warehouse, silently and continuously, for every new event. | |
Root causes
- No enforcement layer
Kafka stores messages as raw bytes with no awareness of structure — no type checking, no contract validation. The schema contract exists only in shared code and the assumption that teams coordinate changes.
- Independent deployments
In multi-team environments, a producer-side schema change requires no approval from consuming teams. By the time the mismatch is detected, both sides have been running in production with conflicting expectations.
Corruption pipeline, business impact and resolution approaches
How one rename corrupts the entire data pipeline
- Producer deploys v2
Field renamed, passes tests
- Events published
New schema enters topic stream
- Consumer reads null
Old field name returns no value
- Corrupt data written
Null propagates to index, DB, warehouse
- User finds the gap
Hours or days later, no alerts ever fired
Business impact: What gets corrupted and what it costs
- Search index
Must be fully rebuilt from source data. Products added during the corruption window are unfindable until reindex completes.
- Data warehouse
Corrupted records require backfilling and revalidation. Analytics on affected windows produce incorrect outputs until corrected.
- ML models
Models trained or evaluated on malformed data produce incorrect outputs, and the error may not surface until model performance degrades in production.
The fix: Schema registry as an enforcement layer
| Producer v2 | Schema Registry
validates compatibility |
Breaking change blocked |

What expert teams do
- Deploy and configure a Schema Registry as the single source of truth for all message formats across producer and consumer teams.
- Implement schema compatibility rules that prevent breaking changes from being deployed, regardless of which team made them or in which service.
- Build schema validation into CI/CD pipelines as a required gate, compatibility failures caught at pull request time, not after deployment.
- Design event schemas for evolution from the start; adding fields or changing optional structures should not require coordinated deployments across teams.
- Run schema governance workshops with producer teams to establish conventions for naming, versioning, and deprecating fields across the organisation.
Challenge #4: Partition Imbalance
How poor key selection overloads individual brokers
How skewed partition keys concentrate traffic and degrade cluster performance
Key symptom
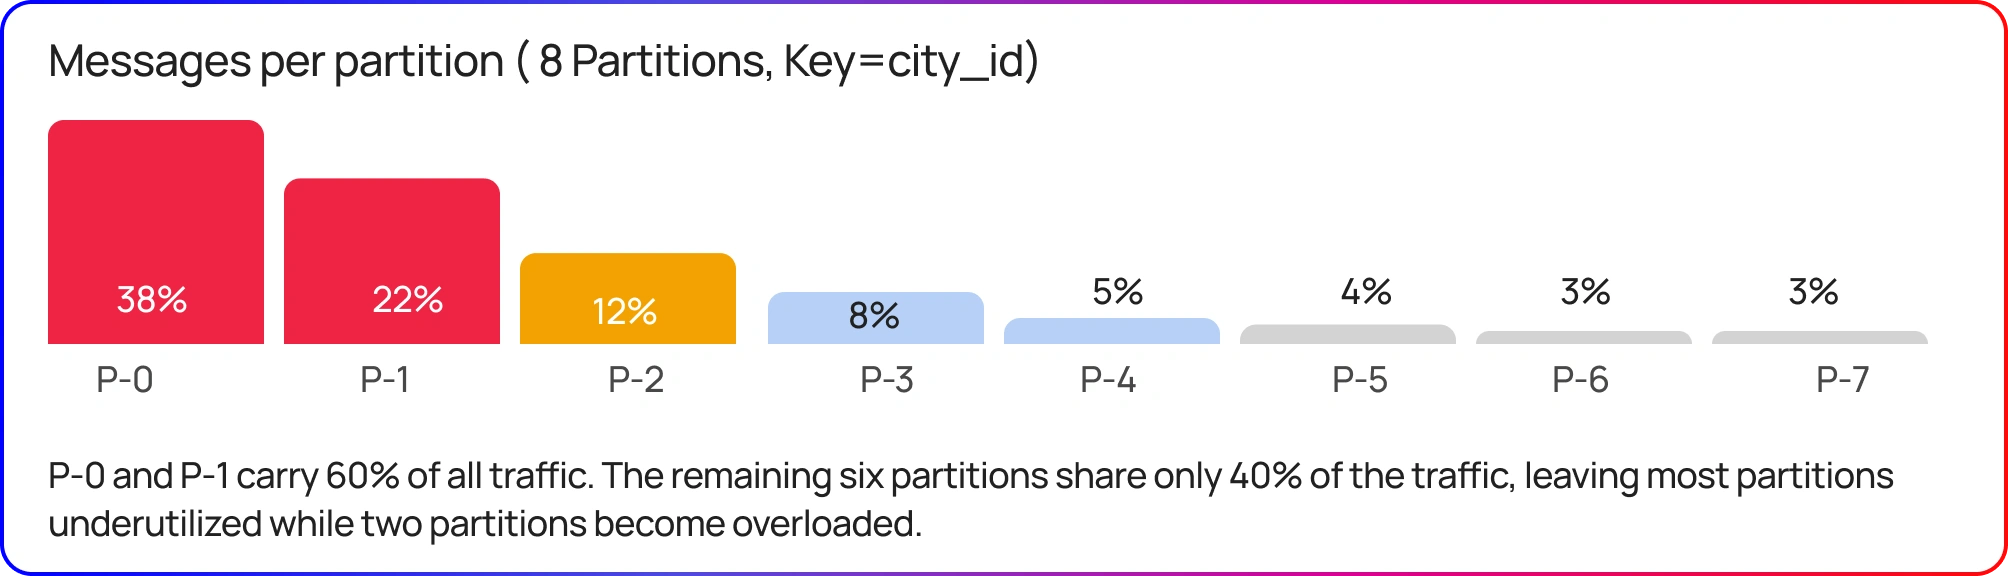
A three-broker cluster: one broker at 90% CPU and elevated disk I/O. The other two at 20% and 15%. Consumer lag is growing, but only on two of eight partitions. The rest are nearly empty. Adding brokers and consumers does nothing. The constraint is not capacity; it is traffic concentration caused by a partition key that appeared reasonable at topic creation time.
Broker utilization: Same cluster, wildly different load
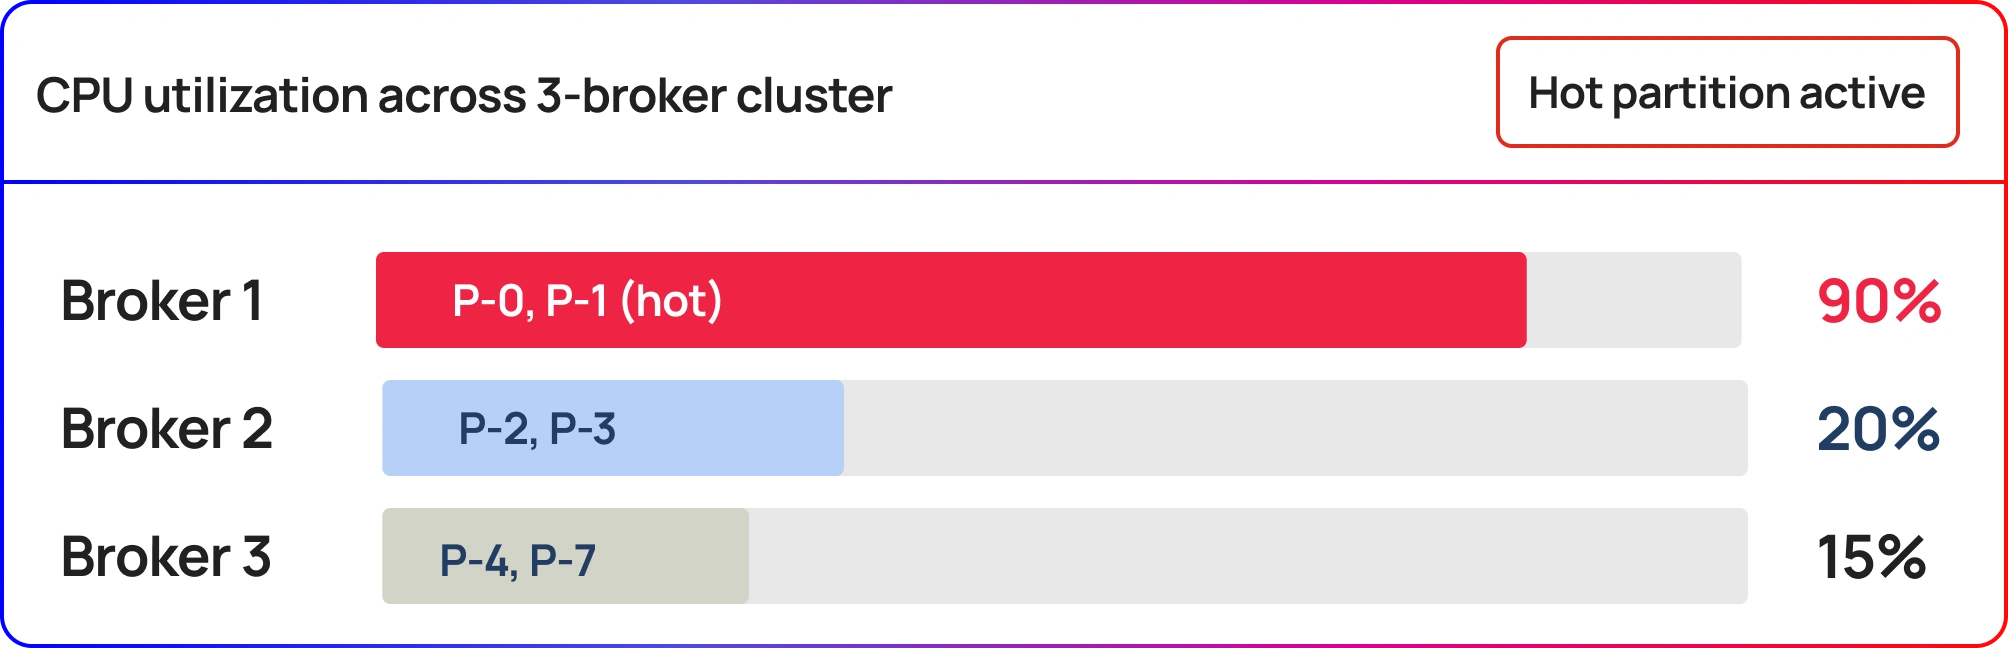
Adding a 4th broker does not redistribute existing partitions. The hot partitions remain on Broker 1. Capacity cannot solve a distribution problem.
Partition traffic distribution: Skewed key in action
Root causes
- Low-cardinality keys
Kafka hashes the message key to assign partitions. High-cardinality keys with uniform distribution spread load evenly. Low-cardinality or skewed keys map the majority of traffic to a small subset of partitions, regardless of how many partitions exist.
- No traffic analysis
The partition key is among the most consequential architectural decisions in topic design. It is frequently selected without analysis of actual traffic distributions and is rarely revisited, until a hot partition has already produced a production incident.
The same pattern across industries
| Ride-sharing
key = city_id 200 city values. 3 cities account for 60% of events, concentrating on specific partitions. |
B2B platforms
key = customer_id A few large enterprise customers dominate event volume, dwarfing hundreds of smaller ones. |
E-commerce
key = category_id Handful of product categories generate the majority of activity, especially during peak seasons. |
Cascade effects, business impact, and resolution approaches
The hot partition cascade: How one skewed key degrades the entire cluster
- Hot partition saturates broker
The overloaded broker generates excess replication traffic to its followers, creating network congestion that affects every topic hosted on that broker, not just the hot one.
- Consumer falls behind
The consumer assigned to the hot partition cannot keep pace. Lag grows on that partition while adjacent partitions remain caught up, making the problem appear random and hard to diagnose.
- Request queues lengthen
As the overloaded broker falls behind, its network and disk request queues grow. Response latency rises for all producers and consumers interacting with that broker.
- Producer retries amplify load
Producers waiting beyond their configured request timeout begin retrying. This increases incoming request volume on an already-saturated broker, compounding the overload further.
Key selection: What breaks vs what works
| Poor key choices
city_id — a few cities dominate all events customer_id — top 3 accounts = 70% of volume category_id — seasonal spikes on 2 categories null key — all messages to one partition |
Better alternatives
user_id — high cardinality, uniform spread order_id / event_id — naturally distributed composite key — city + user sub-segment custom router — splits known hot keys |
The right key depends on cardinality, distribution, and ordering requirements. Expert teams analyze real production traffic before selecting, not assumptions about uniformity.
Business impact
- Latency
Rising response latency on the hot broker affects all topics hosted there, degrading SLAs across unrelated services sharing that broker.
- Throughput
Producer retries during saturation increase traffic on an already overloaded broker, a self-reinforcing degradation loop that capacity cannot break.
- Observability
Lag that appears only on 2 of 8 partitions looks random. Without per-partition monitoring, teams spend hours investigating the wrong component.
What expert teams do differently
- Analyze actual traffic distributions before recommending any partition key, using real production data or realistic load modeling, not assumptions about uniformity.
- Evaluate alternative key candidates against cardinality and distribution criteria, presenting trade-offs clearly so teams make informed decisions.
- Implement custom partition routing for topics with known high-volume keys, distributing traffic across multiple partitions without breaking consumer ordering requirements.
- Monitor per-partition throughput metrics continuously so imbalances are detected early, before they cascade into broker overload and producer retry storms.
- Design corrective migration paths for existing topics with hot partitions, minimising disruption to running consumers during the transition.
Challenge #5: Duplicate Processing
The hidden cost of at-least-once delivery
How default delivery semantics produce duplicate records across distributed systems
Key symptom: The payment duplicate
A payment service publishes a charge event. A network timeout occurs before the broker acknowledgment reaches the producer. The producer retries, following its configured policy. The original message had already been written. The retry produces a second copy. Both are consumed and processed. The customer is charged twice.
This is not a bug. This is the expected behavior of Kafka’s default producer configuration during any network interruption.
| Event sequence: How the duplicate is created | At-least-once default |
| 1. Producer sends charge event to broker | Message sent |
| 2. Broker writes message to partition log successfully | Written to log |
| 3. Network timeout: acknowledgment never reaches the producer | ACK lost |
| 4. Producer assumes failure and retries: sending the message again | Retry triggered |
| 5. Broker accepts retry as a new distinct record: two copies now in log | Duplicate written |
| 6. Both messages consumed and processed: customer charged twice | Double charge |
Delivery semantics: Where Kafka sits by default
- At-most-once
Messages may be lost. No retries. Each message delivered zero or one time.
Risk: data loss
- At-least-once
Messages never lost. Retries guaranteed. Duplicates possible on network failure.
⬅ Kafka default · Risk: duplicates
- Exactly-once
No loss, no duplicates. Requires idempotent producers and transactional APIs.
Requires explicit config
Producer-side path
Producers retry until the broker acknowledges. If a timeout causes a retry for a message already received but unacknowledged, the broker accepts the duplicate as a new distinct record. Both copies reach consumers.
Consumer-side path
A consumer that crashes after processing but before committing its offset restarts at the last committed position, reprocessing every message in between. Neither behavior is a defect. Both are documented defaults.
| Every Kafka deployment that has not explicitly implemented deduplication is processing duplicate messages today. In low-stakes contexts, this is invisible. In financial, inventory, or compliance contexts, it is an active liability. |
Domain impact, idempotency approaches, and resolution
Business impact: What duplicates cost per domain
- Payment systems
Customer charged twice
Each duplicate event triggers a charge. Customers see double charges on their statements. Chargebacks follow. Trust is lost instantly and publicly.
Severity: Critical
- Inventory systems
Stock decremented twice per order
A single sale appears to consume two units. Inventory positions go negative. Fulfillment commitments cannot be met. Overselling follows.
Severity: High
- Analytics pipelines
Metrics inflated by small amounts
Duplicates inflate counts by fractions that appear as rounding errors. Often invisible until a reconciliation process surfaces a persistent discrepancy.
Severity: Low–Medium
- Fraud detection
False positive alerts on valid transactions
Legitimate transactions that appear to repeat trigger fraud rules. Genuine customers are blocked. Detection precision drops as the signal becomes noisy.
Severity: High
| The deeper cost is trust. Systems that occasionally produce incorrect results, even at low rates, erode confidence in the data infrastructure as a whole. When business teams cannot trust that a count is accurate, they stop relying on the system for decisions. |
Idempotency approaches: The three layers
- Idempotent producer
Assigns a unique producer ID and per-partition sequence numbers. Broker detects and discards duplicate retries from the same producer instance automatically.
- Transactional API
Read-process-write atomically with no partial execution. Used when a message must be consumed and a result written in a single guaranteed operation.
- Application-level idempotency
Use processing position (e.g. event_id, offset) as a deduplication key on writes to external systems: database upserts, idempotent API calls.
- Dead Letter Queue
Messages that cannot be safely processed are isolated for examination rather than silently dropped or retried indefinitely into the system.
What expert teams do
- Enable idempotent producer configuration – assigns a unique producer ID and sequence numbers so the broker can detect and discard duplicate retries automatically.
- Implement Kafka’s transactional API for pipelines where a message must be read, processed, and written atomically with no possibility of partial execution.
- Design application-level idempotency for writes to external systems, using processing position as a natural deduplication key on every downstream write.
- Configure exactly-once semantics for Kafka Streams applications – requires compatible broker configuration, replication settings, and transactionally-aware application state operations.
- Build Dead Letter Queue infrastructure so messages that cannot be safely processed are isolated for examination, not silently dropped or retried indefinitely.
Challenge #6: Operational Readiness
Why monitoring, security, and scaling cannot be afterthoughts
Monitoring gaps, security exposure, and scaling complexity that compound over time
Three real incidents: One root cause
- No monitoring
A broker exhausts disk space with no alert configured. It crashes at 2 AM. Affected partitions remain unavailable for four hours because no recovery runbook exists.
- No scaling plan
Two new brokers are provisioned during a traffic spike. They receive zero traffic. Kafka does not redistribute partitions automatically, and the manual reassignment was never initiated.
- No security
A penetration test finds the management port exposed to the public internet with no authentication. Security hardening was absent from the original deployment and no audit had followed.
| Each incident is different. Each is predictable in retrospect. Each shares the same root cause: Kafka’s operational surface – monitoring, security, and scaling – was treated as something to configure later rather than something to architect from the beginning. Operational debt compounds with every new topic, consumer group, and team that touches the cluster. |
Five priority monitoring signals
| Signal | Healthy state | Why it matters |
| Partitions with lagging replicas | Zero always | Even brief replication lag signals broker stress or network issues requiring immediate attention. |
| Active cluster controller count | Exactly 1 | Any value other than exactly 1 indicates a controller election failure requiring immediate investigation. |
| Offline partitions | Zero always | Any offline partition means data is unavailable – must be treated as urgent, not a background task. |
| Consumer group lag trend | Stable ↓ | Growing lag means consumers cannot keep up with producers, a leading indicator of pipeline failure. |
| Broker disk utilization | < 60% | Brokers that fill their disks stop accepting writes entirely, with no graceful degradation before failure. |
Three operational areas: All required from day one
- Monitoring
Continuous observation with defined alert thresholds, escalation procedures, and written runbooks for every condition.
- Security
Four independent layers: encryption, authentication, authorization, and audit logging, all off by default in Kafka.
- Scaling
Partition reassignment is manual, carries replication risk, and must be throttled. Adding brokers alone does nothing.
Security layers, scaling process, compliance and resolution approaches
Four security layers: All required, all off by default
| Encryption in transit | Protects data interception between clients, brokers, and across networks. Requires TLS configuration on all listeners and client connections. | TLS / SSL |
| Authentication | Prevents unauthorized clients from connecting to brokers and impersonating legitimate services. Requires SASL configuration with an appropriate mechanism. | SASL / mTLS |
| Authorization | Prevents legitimate clients from accessing topics or operations they should not be permitted to use. Requires ACL configuration per principal and resource. | ACLs / RBAC |
| Audit logging | Detects access pattern changes, closes compliance gaps, and enables post-incident forensics. Required for SOC 2, HIPAA, and PCI-DSS in regulated environments. | Audit trail |
Kafka ships with all four layers disabled by default. In development, this is convenient. In production, it is an exposure. Each layer must be configured correctly and verified regularly.
Correct broker scaling sequence: Reassignment is not automatic
- Add new brokers
Brokers join the cluster with zero partitions
- Generate reassignment plan
Identify which partitions to move and where
- Set throttle limits
Cap replication bandwidth to protect production traffic
- Execute with monitoring
Run during low-traffic window, watch for latency spikes
- Verify balance
Confirm per-broker partition and traffic distribution
Compliance frameworks: Security config aligned to industry
- SOC 2
Encryption, access control, and audit logging across all four security layers with documented policies.
- HIPAA
PHI in transit and at rest, authentication, authorization, and access audit trails for healthcare data.
- PCI-DSS
Cardholder data protection, network segmentation, strong authentication, and continuous monitoring for payments.
What expert teams do
- Deploy a production-grade observability stack with pre-built dashboards and alert routing, including written runbooks for every alert condition, so on-call engineers can resolve issues without requiring a Kafka expert on every call.
- Conduct security posture assessments across all four security layers, delivering prioritized findings with severity ratings and remediation timelines.
- Implement partition reassignment procedures with appropriate throttling and monitoring so that scaling events do not create production incidents.
- Establish proactive capacity planning that identifies disk, network, and CPU constraints before they trigger failures, not after an incident forces the conversation.
- Create security configurations aligned to SOC 2, HIPAA, or PCI-DSS with compliance documentation ready for audit, depending on industry requirements.
The Value of Specialized Kafka Expertise
Organizations that operate Kafka reliably share a common characteristic: they treat configuration, architecture, and operations as deliberate engineering decisions, not defaults to be accepted. Each challenge in this guide is addressable through well-understood patterns. The distinction between teams that prevent these problems and teams that encounter them through incidents is not capability, but it is accumulated operational experience.
What specialized expertise delivers across three dimensions
- Speed of diagnosis
Expert teams recognize failure patterns immediately because they have seen them before. A lag investigation that takes an internal team days takes an experienced specialist hours.
Days → Hours
- Quality of the fix
Teams learning a system often address symptoms rather than root causes. Expert teams understand the interaction effects that make changes beneficial in one place but harmful in another.
Symptoms → Root cause
- Transfer of knowledge
The most valuable outcome is not the fix itself but the understanding your team develops of why it works, so the next incident is diagnosed faster or prevented entirely.
Fix → Capability
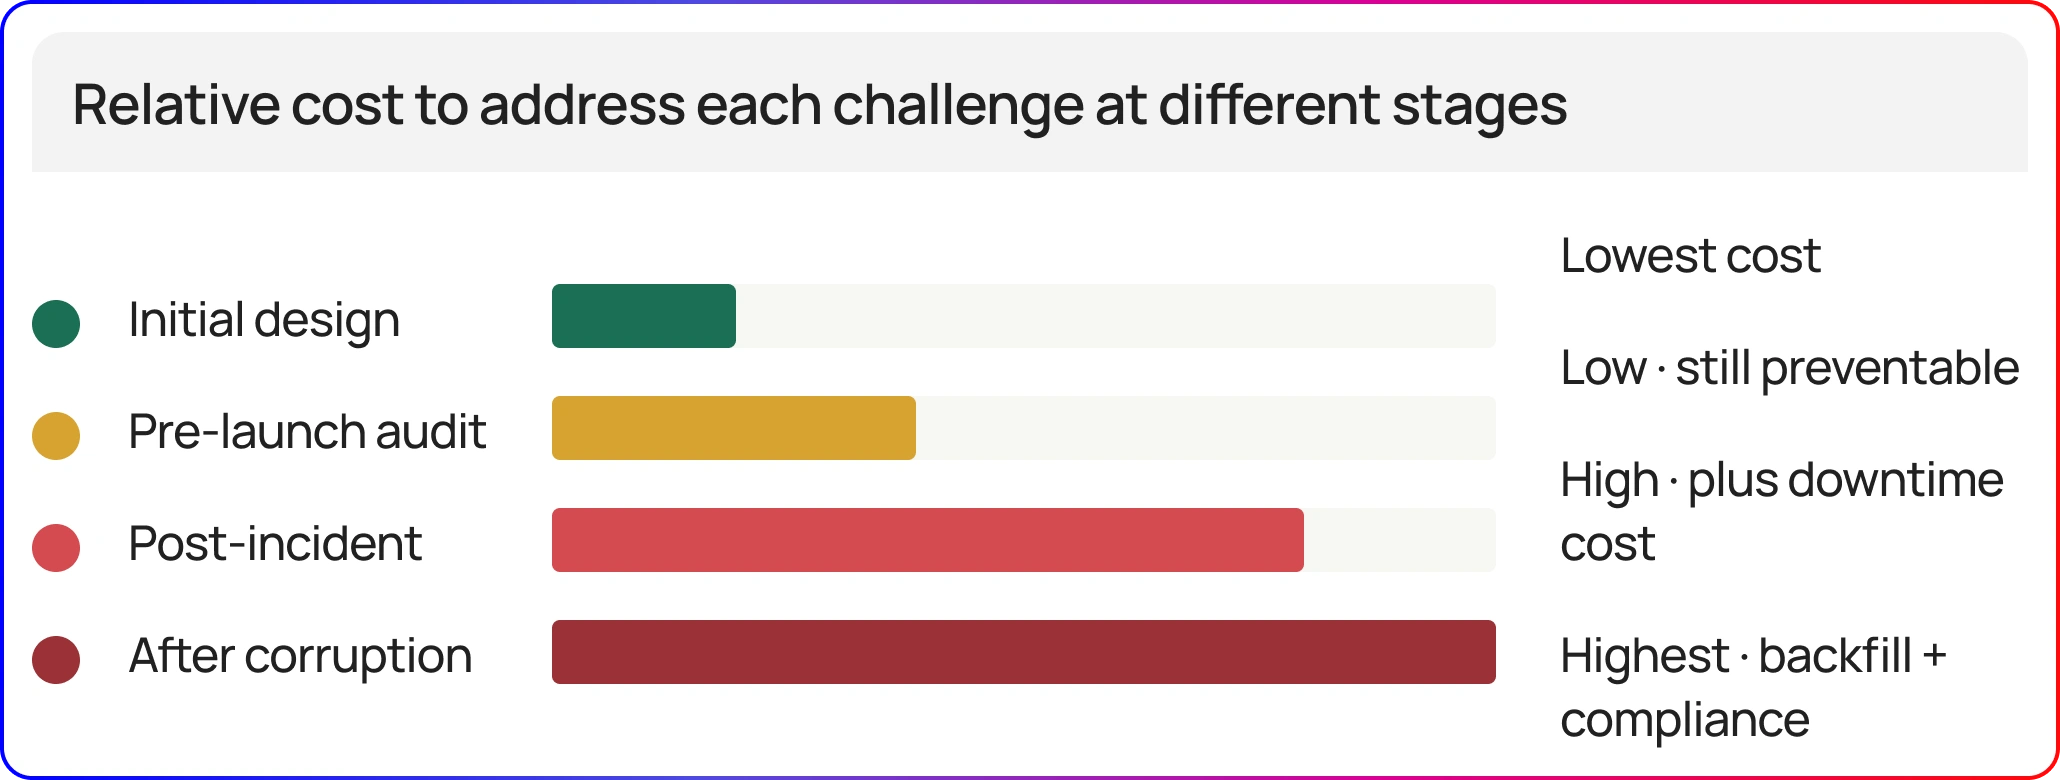
The cost of delayed action: Remediation cost by intervention point
For new deployments
The lowest-cost point at which to address any of these challenges is during initial design and deployment, before partition keys are set, before topics are created, and before consumers are written against defaults.
For existing infrastructure
A structured assessment and remediation engagement is the most effective path to reducing exposure, identifying which challenges are active, which are latent, and which require architectural intervention versus configuration changes.
Ksolves India Limited BSE Publicly Listed
Every challenge in this guide is a structured engagement we deliver.
Our Data Engineering practice has designed, implemented, operated, and rescued Apache Kafka deployments across financial services, e-commerce, healthcare, logistics, and other industries worldwide.
| 8
Service areas |
50
Industries served |
24/7
Managed ops SLA |
60 min
Free consultation |
Kafka service portfolio
- Architecture & Design Review
Findings report, config baseline, and remediation roadmap against your actual throughput numbers.
- Schema Registry & Governance
Full compatibility enforcement, CI/CD validation pipelines, and producer team workshops.
- Performance & Lag Remediation
Per-partition lag forensics, realistic load benchmarking, and partition key analysis.
- Reliability Engineering
Durability audit, idempotent producers, transactional pipelines, and DLQ infrastructure.
- Observability Platform
Prometheus + Grafana stack, consumer lag alerting, and written runbooks for every alert.
- Security Hardening
Four-layer assessment, TLS/SASL implementation, ACL framework, and SOC 2 / HIPAA / PCI-DSS docs.
- Migration & Modernization
ZooKeeper → KRaft, version upgrades, on-prem to cloud, and MirrorMaker 2 replication.
- Managed Operations
24/7 monitoring with incident SLAs, capacity planning, patching, and monthly reviews.
Why businesses choose Ksolves
- Production-Proven Expertise
Patterns in this guide are drawn from real production environments, not theory.
- End-to-End Ownership
Design through day-2 ops: one partner, no handoffs, complete accountability.
- Knowledge Transfer First
Every engagement leaves your team more capable, not dependent on us.
- Technology-Agnostic
OSS Kafka, Confluent, MSK, Event Hubs, we recommend what fits you.