

How to Use the GA4 Purchase Journey Report to Reduce Cart Abandonment in Salesforce Commerce Cloud
Salesforce
5 MIN READ
March 31, 2026
![]()
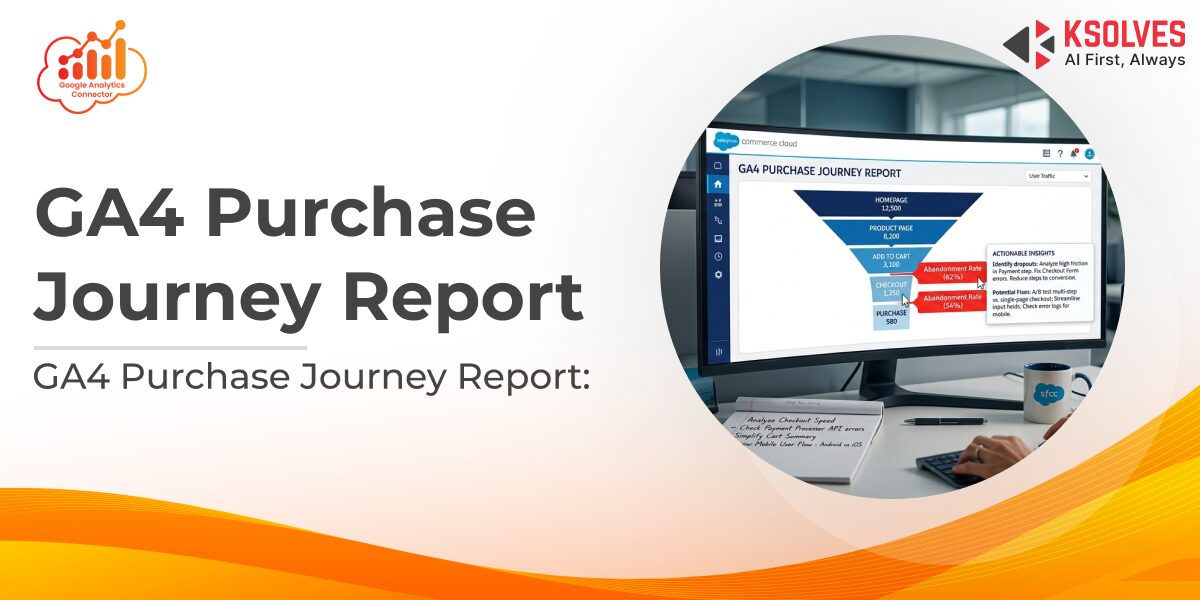
The GA4 Purchase Journey report shows Salesforce Commerce Cloud store managers exactly where shoppers leave the checkout funnel, step by step. This guide walks you through how to open it, what to look for at each stage, and what action to take based on what you find.
Your cart abandonment rate is up. Sessions look healthy. But nothing in your standard reports tells you whether shoppers are leaving on the product page, at the cart, mid-checkout, or right before payment goes through. That distinction matters, each stage points to a different cause and a different fix. The GA4 purchase journey report SFCC teams can access through the Google Analytics Connector gives you exactly that breakdown. Here is how to use it.
How to Find and Read the Purchase Journey Report
Go to your GA4 property and navigate to Reports > Monetization > Purchase Journey. You will see a funnel of seven sequential stages, each mapped to a standard ecommerce event that the Google Analytics Connector sends automatically from your SFCC storefront:
- Session Start: user lands on your store
- View Item: user opens a product page
- Add to Cart: item is added to the cart
- View Cart: user opens and reviews the cart
- Begin Checkout: user initiates the checkout flow
- Add Shipping / Payment Info: user completes address and payment steps
- Purchase: transaction is confirmed
Each stage shows how many users reached it and what percentage abandoned it at that point. The percentage displayed between stages is the drop-off rate. A 65% drop between Add to Cart and View Cart means 65 out of every 100 users who added an item never returned to review it. Scan the funnel from top to bottom and find the steepest drop. That is where you start.
Also Read – 5 Ways Google Analytics Connector Boosts Customer Retention in E-commerce
What Each Drop-off Stage Is Telling You
High drop-off at different stages signals different problems. Here is what to investigate at each one:
- View Item to Add to Cart: the product page is not convincing enough. Check whether the Add to Cart button is visible without scrolling on mobile and whether pricing and reviews appear above the fold.
- Add to Cart to View Cart: users are adding items but not committing. This often reflects shipping cost anxiety. Showing estimated delivery cost on the product page before the cart reduces this drop significantly.
- View Cart to Begin Checkout: something at the cart stage is creating friction. Look at coupon codes that are not applying correctly, late-appearing out-of-stock warnings, or a missing guest checkout option. The Google Analytics Connector tracks coupon apply and remove events, so you can see directly whether failed discount codes are contributing.
- Begin Checkout to Add Shipping / Payment Info: form friction lives here. Too many required fields, no address autocomplete, or a missing payment method. Filter this stage by device in GA4 — mobile drop-off at this step is almost always higher than desktop and typically points to layout issues on smaller screens.
- Add Shipping / Payment Info to Purchase: the shopper was ready to buy and something stopped them at the last step. Check for JavaScript errors on the confirmation page, slow load times, or a 3D Secure authentication step that is not completing correctly.
Also Read – Top 5 E-commerce Metrics to Track with Google Analytics 4 Ecommerce and SFCC
Segments That Change the Picture
Once you have identified the problem stage, open GA4’s Explore tab, build a custom funnel using the same events, and apply segments. Comparing new users against returning users regularly reveals different problems at the same stage: returning users abandoning at the payment step often points to a saved card not loading, while new user drop-off at the same stage usually means payment method gaps.
The Google Analytics Connector also tracks wishlist activity, when users add or remove items during a session. A high volume of wishlist ads alongside low checkout starts is a retargeting signal, not a checkout fix. Those users need a different follow-up than someone who reached the payment step and bounced.
Also Read – Maximize ROI: Optimizing Ad Spend with GA4 and SFCC Data
Turning the Report into Recovery Actions
The Purchase Journey report tells you where to focus. Here is how to act on what it shows:
- On-site fixes
Address the friction at the specific stage with the highest drop-off. Product page layout, guest checkout availability, form field reduction, and payment option coverage are the most common levers for SFCC stores.
- Remarketing
Users who reached Begin Checkout but did not purchase are your highest-intent abandoners. Build this as a GA4 audience and activate it through your connected ad channels via Google Tag Manager, the Google Analytics Connector supports syncing with Facebook Pixel, LinkedIn Insight Tag, and Twitter Tag.
- Recovery emails:
Use View Cart event data as the trigger for cart abandonment flows. Users who viewed their cart but never started checkout respond to a product-focused reminder. Users who reached the payment step need a direct link back to where they stopped, not a generic cart email.
Conclusion
Cart abandonment is not one problem, it is several, stacked at different points in the funnel. The GA4 Purchase Journey report gives Salesforce Commerce Cloud teams the visibility to separate them. Read the drop-off rates stage by stage, find where your store is losing the most users, and work the fix that matches that stage. Everything else is secondary until the biggest gap is closed.
To bring the full Purchase Journey report to your SFCC store, including View Cart, coupon, wishlist, and checkout event tracking, explore the Google Analytics Connector at ksolves.com/google-analytics-connector.
Frequently Asked Questions
Q1. Where do I find the Purchase Journey report in GA4?
Go to Reports > Monetization > Purchase Journey in your GA4 property. The report is available once ecommerce events are flowing from your SFCC store.
Q2. What events does the GA4 Purchase Journey report track for SFCC stores?
Seven stages: session start, view_item, add_to_cart, view_cart, begin_checkout, add_shipping_info and add_payment_info, and purchase. The Google Analytics Connector maps all of these automatically – no custom development required.
Q3. How is the drop-off percentage calculated?
It is the proportion of users who reached a stage but did not proceed to the next one. A 70% drop between Add to Cart and View Cart means 70% of users who added an item did not return to review their cart in that session.
Q4. Does the Google Analytics Connector require custom development?
No. It integrates GA4 with Salesforce Commerce Cloud through Google Tag Manager, with free setup and no custom code required on your storefront.
Q5. Which drop-off stage should SFCC stores prioritise first?
Start with the stage that has the largest absolute number of users dropping off – not just the highest percentage. Begin Checkout to Purchase is often the highest-value stage to fix because those users have already committed to buying.
![]()


Author
About the Author Editorial Team The Ksolves Editorial Team includes certified Salesforce experts, Big Data engineers, AI/ML specialists, Zoho consultants, and experienced technology writers focused on delivering clear, actionable insights for modern businesses. With hands-on experience across Salesforce, Big Data platforms, AI/ML solutions, application development, software testing, and Zoho ERP/CRM, the team publishes practical guides, real-world use cases, and industry updates that support smarter decisions and faster growth. Every article is created to solve business challenges, guide technology adoption, and keep organizations aligned with evolving digital ecosystems.
Share with