



How Retail Businesses Track Multi-Store Sales, Inventory, and Customer KPIs in One Dashboard
Odoo
5 MIN READ
July 10, 2026

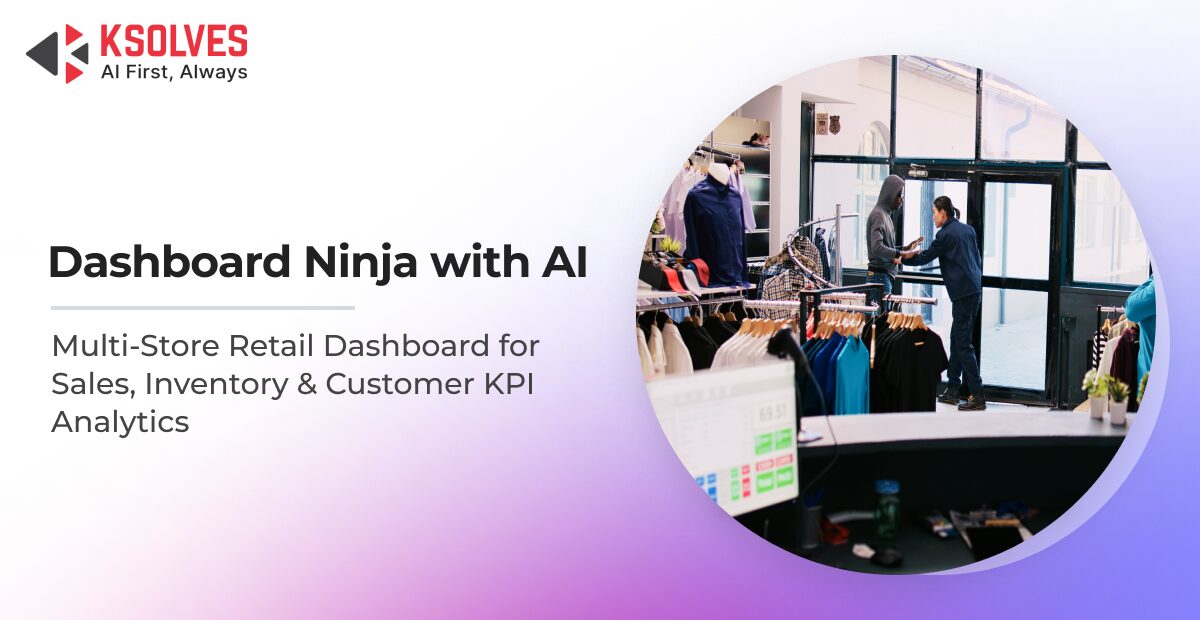
A retail business rarely struggles because of a lack of data; it struggles because the data lives everywhere.
One store is running out of stock, another is overstocked, sales trends shift overnight, and customer preferences change faster than weekly reports can capture. For multi-store retailers, visibility becomes the difference between reacting late and scaling profitably.
This is why modern retailers are replacing disconnected spreadsheets and static reports with AI-powered dashboards that bring sales, inventory, customer behavior, and operational KPIs into one real-time view.
With the #1 app on the Odoo Store, Dashboard Ninja with AI by Ksolves, retail businesses can track every store, product movement, and customer trend from a single intelligent dashboard, making faster, smarter, and more profitable decisions every day.
In this blog, we will explore how retail businesses use centralized AI-powered dashboards to monitor multi-store sales, inventory, and customer KPIs while improving operational efficiency and decision-making.
The Growing Complexity of Multi-Store Retail Management
Modern retail operations generate data continuously across every store, warehouse, sales channel, and customer touchpoint. From POS billing and inventory movement to customer behavior and supplier operations, retailers are managing far more operational data than traditional reporting systems were designed to handle.
A multi-store retail business typically processes:
- POS transactions
- Inventory movement
- Customer purchases
- Supplier and procurement updates
- Warehouse transfers
- Loyalty program activity
- Omnichannel sales data
- Returns and refund tracking
When information remains scattered across spreadsheets, disconnected software, and manual reports, retail teams struggle to make fast and accurate business decisions.
Common Problems Retail Businesses Face
1. Inconsistent Sales Reporting
Different stores often follow different reporting structures, making performance comparison difficult and time-consuming.
Retail leaders struggle to:
- Standardize reporting across locations.
- Compare store performance accurately.
- Track real-time revenue trends.
- Identify underperforming stores quickly.
As retail operations scale, reporting inconsistencies create major visibility gaps for management teams.
2. Inventory Visibility Issues
Inventory management becomes increasingly complex when multiple stores and warehouses operate independently.
Retailers often struggle to identify:
- Which stores are overstocked?
- Which products are nearing stockout?
- Which SKUs are slow-moving?
- Where inventory imbalances exist?
Without centralized visibility, businesses either lose sales due to unavailable stock or increase operational costs by carrying excess inventory.
3. Delayed Decision-Making
Many retail businesses still rely on:
- Manual exports.
- Excel-based reporting.
- Periodic reconciliations.
- End-of-day data consolidation.
This creates delays in operational visibility.
By the time management reviews reports, demand patterns may already have shifted, inventory shortages may have impacted sales, and revenue opportunities may already be missed.
4. Limited Customer Insights
Customer data often remains fragmented across:
- POS systems
- CRM platforms
- eCommerce channels
- Loyalty applications
Without centralized analytics, retailers struggle to track:
- Repeat purchase behavior.
- Customer lifetime value.
- Regional buying preferences.
- Product affinity trends.
- Customer retention patterns.
This limits personalization and weakens customer engagement strategies.
5. Lack of Cross-Store Operational Visibility
Retail leaders need a unified view of operations across all locations, but disconnected systems make this difficult.
Businesses often lack real-time visibility into:
- Store-wise profitability.
- Regional sales performance.
- Inventory distribution efficiency.
- Operational bottlenecks.
- Store productivity metrics.
As a result, decision-making becomes reactive instead of data-driven and proactive.
Fix Fragmented Retail Reporting with Dashboard Ninja with AI
Why Traditional Retail Reporting No Longer Works
Retail operations today require real-time intelligence, not static reports.
Traditional methods fail because they:
- Depend on manual data collection.
- Increase reporting errors.
- Create reporting delays.
- Lack predictive capabilities.
- Cannot process large-scale omnichannel data efficiently.
According to research from McKinsey & Company, AI-driven analytics in retail can significantly improve forecasting accuracy and operational efficiency by enabling faster, data-driven decisions.
Modern retail businesses need dashboards that not only display data but also generate actionable insights automatically.
What is a Unified Retail KPI Dashboard?
A unified retail dashboard is a centralized analytics system that consolidates operational, sales, inventory, and customer data from all retail locations into one interface.
It acts as a single source of truth for decision-makers.
With integrated ERP systems like Odoo, retailers can monitor every critical metric across stores in real time.
Key Benefits of a Centralized Retail Dashboard
- Faster Decision-Making: Retail managers no longer wait for weekly reports. Real-time dashboards enable immediate action.
- Better Inventory Control: Businesses can track stock movement across all stores and warehouses instantly.
- Improved Customer Experience: Retailers can ensure better product availability and personalized engagement.
- Reduced Manual Reporting: Automated dashboards eliminate repetitive data compilation tasks.
- Better Business Scalability: Retail chains can expand operations without increasing reporting complexity.
Core Sales KPIs Retail Businesses Track
Sales visibility is one of the biggest priorities for multi-store retailers.
A centralized dashboard enables businesses to monitor sales performance across every location simultaneously.
1. Revenue Tracking Across Stores
Retail dashboards track:
- Total sales revenue.
- Store-wise revenue contribution.
- Daily, weekly, and monthly trends.
- Regional performance analysis.
- Target vs actual sales.
This helps leadership quickly identify:
- Top-performing stores.
- Seasonal demand patterns.
- Revenue decline trends.
2. Product Performance Analytics
Retailers also monitor:
- Best-selling products.
- Low-performing SKUs.
- Category-wise sales.
- Product return rates.
- Promotional campaign performance.
AI-powered dashboards can automatically identify:
- High-margin products.
- Fast-growing categories.
- Demand spikes.
- Seasonal buying behavior.
3. Store Performance Monitoring
Multi-store dashboards make it easier to compare:
- Footfall conversion rates.
- Average order value.
- Sales per employee.
- Revenue per square foot.
- Regional profitability.
This allows businesses to optimize staffing, promotions, and operational planning.
Also Read: How to Build Your First Sales Dashboard in Dashboard Ninja with AI
Inventory KPIs Retailers Monitor in Real Time
Inventory directly impacts profitability in retail.
Excess inventory increases holding costs, while stock shortages reduce customer satisfaction and revenue.
This is why inventory dashboards are critical for retail operations.
1. Real-Time Inventory Visibility
Retail businesses monitor:
- Live stock levels.
- Inventory availability by store.
- Warehouse inventory.
- In-transit stock.
- Inter-store transfers.
With centralized dashboards, businesses can instantly identify:
- Overstock situations.
- Stock imbalances.
- Dead inventory.
- Urgent replenishment needs.
Also Read: Boost Your Retail Sales with Inventory Dashboard Ninja
2. Stock Optimization Metrics
AI-powered retail dashboards track:
- Fast-moving products.
- Slow-moving inventory.
- Inventory turnover ratio.
- Stock aging.
- Reorder thresholds.
Predictive analytics further helps retailers forecast future demand based on:
- Historical sales.
- Seasonal trends.
- Market demand fluctuations.
- Promotional activities.
3. Supply Chain & Vendor Monitoring
Retailers also track:
- Purchase order status.
- Vendor delivery timelines.
- Supplier reliability.
- Procurement efficiency.
- Lead times.
This helps improve procurement planning and reduce delays.
Customer KPIs Retailers Analyze
Modern retail success depends heavily on customer intelligence.
Retail dashboards consolidate customer data from POS systems, CRM platforms, eCommerce channels, and loyalty programs.
1. Customer Behavior Analytics
Retailers monitor:
- Repeat purchase rates.
- Customer retention.
- Purchase frequency.
- Average order value.
- Customer acquisition costs.
AI-powered dashboards can also identify:
- High-value customers.
- Churn risks.
- Buying patterns.
- Cross-selling opportunities.
2. Loyalty & Engagement Metrics
Businesses track:
- Loyalty program participation.
- Reward redemption rates.
- Customer engagement trends.
- Referral activity.
This enables more personalized marketing strategies.
3. Omnichannel Customer Insights
Today’s customers interact across:
- Physical stores.
- Online marketplaces.
- Mobile apps.
- Social commerce channels.
Unified dashboards help retailers understand:
- Online vs offline buying behavior.
- Regional customer preferences.
- Channel-wise revenue performance.
Turn Customer Data into Insights with Dashboard Ninja with AI!
How Odoo Helps Retailers Centralize Operations
Managing multiple retail stores becomes significantly easier when every operational function works within a single connected system. Instead of switching between separate tools for sales, inventory, accounting, and customer management, retailers can centralize operations through Odoo’s integrated ERP ecosystem.
Odoo connects critical retail functions such as:
- Point of Sale (POS)
- Inventory & warehouse management
- Sales operations
- CRM and customer management
- Accounting & invoicing
- eCommerce operations
- Purchase & vendor management
into one unified platform with synchronized real-time data.
For multi-store retailers, this eliminates:
- Data silos between departments.
- Duplicate data entry.
- Reporting inconsistencies.
- Delayed operational visibility.
- Dependency on disconnected software systems.
As a result, retail businesses gain a centralized operational structure where every store, warehouse, transaction, and customer interaction becomes easier to monitor and manage.
Real-Time Retail Dashboard Capabilities in Odoo
One of Odoo’s biggest advantages for retailers is its ability to provide real-time operational visibility through customizable dashboards and integrated analytics.
Retail businesses can monitor:
- Live sales performance across stores
- Real-time inventory movement
- Product-wise revenue trends
- Customer purchase behavior
- Store-wise profitability
- Procurement and vendor operations
- Order fulfillment status
- Warehouse stock availability
from a single dashboard interface.
This enables retail teams to make faster business decisions without waiting for manual reports or end-of-day data consolidation.
How Dashboard Ninja with AI Enhances Retail Analytics
While Odoo provides powerful operational capabilities for retailers, modern retail businesses require deeper analytics, faster visualization, and AI-driven intelligence to manage large-scale multi-store operations efficiently.
This is where Dashboard Ninja with AI by Ksolves adds significant value.
The platform enhances Odoo’s native reporting capabilities with advanced dashboard customization, real-time visualization, AI-powered insights, and intelligent KPI monitoring, allowing retailers to transform operational data into actionable business intelligence.
Retail businesses can use Dashboard Ninja with AI to:
- Create dynamic retail KPI dashboards.
- Monitor multi-store sales performance in real time.
- Visualize inventory movement across warehouses and stores.
- Analyze customer trends and buying behavior.
- Track operational bottlenecks instantly.
- Generate AI-powered business insights.
- Build custom dashboards for different departments.
- Access business intelligence without manual report creation.
Instead of spending hours compiling spreadsheets and reports, decision-makers get a centralized, visual, and AI-assisted view of retail operations.
Key Features of Dashboard Ninja with AI for Retail Businesses
1. AI-Powered Business Insights
Dashboard Ninja with AI helps retailers move beyond static reporting by generating intelligent operational insights automatically.
Retail teams can identify:
- Sales anomalies
- Sudden demand spikes
- Inventory risks
- Declining product performance
- Store-wise performance fluctuations
This enables faster and more proactive decision-making.
2. Real-Time Dashboard Synchronization
Retail operations change continuously throughout the day.
Dashboard Ninja with AI provides real-time dashboard updates across:
- Retail stores
- Warehouses
- POS systems
- Sales operations
- Procurement activities
This ensures management teams always work with the latest operational data.
3. Advanced KPI Visualization
The platform offers highly interactive and visually rich dashboards with:
- Charts
- Graphs
- KPI cards
- Pivot views
- Tables
- Heatmaps
- Comparative analytics
Retailers can monitor operational trends more intuitively and identify issues faster.
4. Custom Dashboard Creation
Different retail teams require different business metrics.
Dashboard Ninja with AI allows businesses to create fully customized dashboards for:
- Store managers
- Inventory planners
- Operations leaders
- Finance teams
- Executives
- Regional managers
Each team can access role-specific KPIs relevant to their operational responsibilities.
5. Drag-and-Drop Dashboard Builder
Retail users can create dashboards without complex technical configurations using intuitive drag-and-drop dashboard design capabilities.
This simplifies:
- Dashboard customization
- KPI arrangement
- Widget configuration
- Visual report building
6. Multi-Store & Cross-Company Analytics
Retail chains operating across multiple stores, warehouses, or business entities can consolidate operational data into one centralized analytical view.
Businesses can compare:
- Store-wise sales
- Regional revenue trends
- Inventory distribution
- Customer performance metrics
- Profitability across locations
from a single dashboard interface.
8. AI-Assisted Forecasting & Trend Analysis
Dashboard Ninja with AI helps retailers analyze:
- Historical sales trends
- Seasonal buying patterns
- Inventory consumption
- Customer purchasing behavior
This supports:
- Better demand forecasting
- Smarter inventory planning
- Improved procurement decisions
- Reduced stockouts and overstocking
9. Scheduled Reports & Automated Sharing
Retail teams can automate dashboard reporting and share insights across departments through:
- Scheduled email reports
- Automated dashboard exports
- Real-time KPI sharing
This reduces manual reporting effort and improves organizational visibility.
10. Mobile-Friendly Dashboard Access
Retail leaders and store managers can monitor business performance from anywhere using mobile-responsive dashboards.
This enables:
- Faster approvals
- Instant KPI monitoring
- Real-time operational visibility on the go
Final Words
When sales, inventory, and customer insights remain fragmented, even the most established retail businesses struggle with delayed decisions and missed opportunities.
A unified approach powered by Odoo helps retailers bring every operational layer into one system, while AI-enhanced analytics platforms like Dashboard Ninja with AI by Ksolves turn that data into real-time, actionable intelligence.
Businesses that adopt centralized, AI-driven dashboards are not just improving visibility; they are building a foundation for faster growth, better customer experiences, and stronger profitability across every store.
Buy now from
- Odoo Store: https://apps.odoo.com/apps/modules/19.0/ks_dashboard_ninja
- Ksolves Store: https://store.ksolves.com/shop/product/dashboard-ninja-with-ai-v-19.0






























AUTHOR
Odoo
Share with