
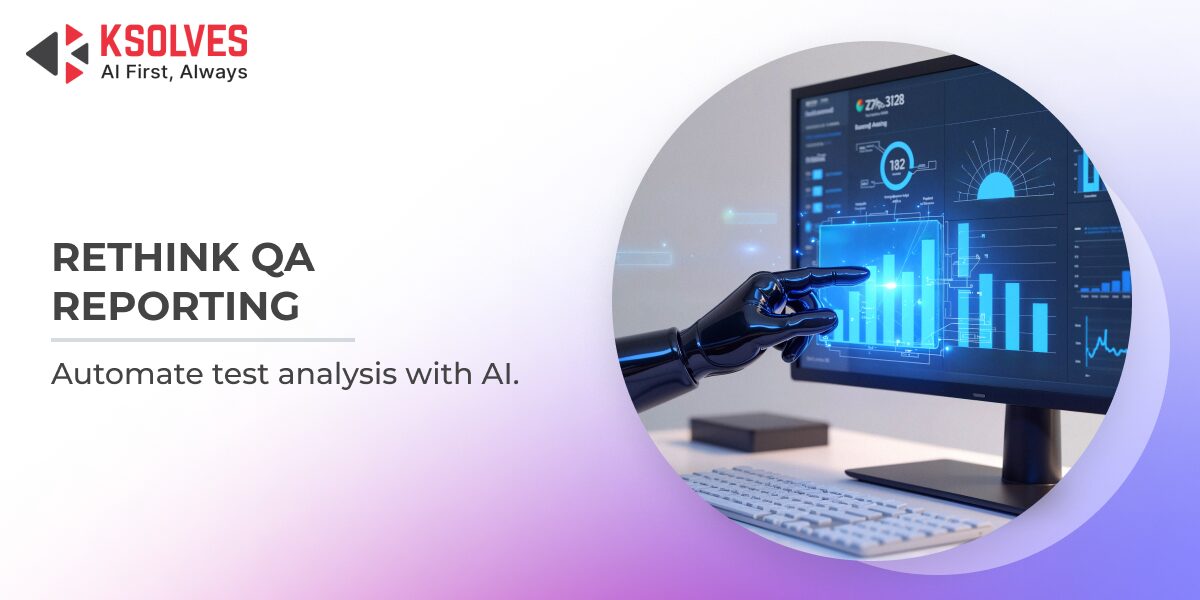
Is Your QA Reporting Falling Behind Your Test Runs?
QA
5 MIN READ
June 30, 2026
![]()
QA teams today run more automated tests, more often, than ever before. Suites execute on every commit, nightly, and across environments, generating a steady stream of pass/fail data. But generating results and understanding them are different things. The bottleneck has quietly shifted from running tests to making sense of what those runs are telling you.
The result is familiar across most engineering organizations: a green or red number nobody has time to interrogate, failures untriaged between sprints, and a widening gap between what the test suite knows and what the team acts on. The challenge is not effort or expertise but the manual work of turning hundreds of test outcomes into a clear picture of risk.
This blog explores why QA reporting workflows are under strain, what a smarter approach to test analysis looks like, and how AI-powered tooling helps teams triage faster, catch regressions earlier, and turn every run into a decision instead of a data dump.
The Real Cost of Reading Test Results by Hand
This is not just anecdotal. According to a report from the Consortium for Information and Software Quality (CISQ), poor software quality costs US businesses an estimated $2.41 trillion, and unresolved technical debt, the deficiencies left unfixed because nobody caught them in time, accounted for roughly $1.52 trillion of that figure. Much of that cost is not about detection but interpretation. A failure gets recorded, but nobody connects it to a root cause, a regression, or a release risk in time to act.
The typical manual workflow demands a lot from QA professionals after each run: opening the report, scanning dozens or hundreds of results, separating real defects from flaky tests and noise, comparing against the previous run, flagging at-risk modules, and writing a summary that leadership can use.
For a suite of any real size, that can consume hours every cycle, and depends on context that lives in one or two engineers’ heads, like which tests are historically flaky, what failed last week, or which failure is a release blocker. These are structural constraints of working by hand, not a reflection of the people doing it.
What Smarter QA Reporting Actually Looks Like
The limits of manual triage are well understood. What is harder to solve is an alternative that reads directly from where the data already lives, understands patterns across runs, and produces output a whole team can act on without a dedicated analyst. An AI-powered QA insights dashboard does exactly that. It shifts the work of interpreting results away from the engineer and onto an intelligent layer that observes, correlates, and explains, reading run summaries straight from your CI pipeline and object storage and handling the interpretation automatically.
The output is not a wall of charts that still needs a human to conclude. It is a structured, decision-ready analysis built from five elements.
- A clear health verdict for the run
- A triage table separating genuine defects from test issues, environmental problems, data problems, and flaky behavior
- A delta view showing what regressed since the last run, what is newly failing, what keeps recurring, and what was resolved
- Surfaced patterns nearly impossible to see in a single report, including flaky tests, consistently failing tests, and the modules accumulating the most failures
- A plain-language management summary stating overall health and whether anything is blocking release
Reach matters just as much. An analysis living only on one engineer’s screen does not solve the bottleneck. Smarter tooling pushes the verdict to where the team already works, delivering the summary straight into Microsoft Teams the moment a run completes, so everyone sees the same picture without anyone assembling it by hand.
Also Read – Manual Testing vs Test Automation, A Complete Technical Breakdown for Modern QA Teams
From Raw Test Logs to Boardroom-Ready Insight, The Ksolves Approach
About the Client
An engineering team running a large Playwright automation suite for a mission-critical platform, executing on AWS CodeBuild across multiple builds and environments.
The Problem
Every run produced results, but turning them into action was slow and manual. Failures sat untriaged between sprints, regressions were spotted late, flaky tests eroded trust in the suite, and leadership rarely got a clear, timely read on release risk.
The Solution
Ksolves built the AI QA Insights Dashboard to read run summaries directly from cloud storage, visualize pass rates, smoke health, and run history, and use AI to auto-generate failure triage, root-cause clusters, a run-over-run delta view, top risks, and a plain-language management summary, then push it all to the team in Microsoft Teams.
The Impact
- Triage that once took hours of manual scanning now arrives automatically the moment a run finishes.
- Regressions and newly failing tests are flagged instantly against the previous run, so they are caught the same day rather than in sprints later.
- Flaky and consistently failing tests are identified across run history, removing reliance on tribal knowledge.
- Leadership receives a clear GREEN / YELLOW / RED verdict and a jargon-free summary, with release-blocking items called out explicitly.
- Reporting reaches the whole team in one click via Teams, instead of being copy-pasted by an individual.
Competitive Comparison
| Characteristic | Manual Triage | Generic Dashboards | AI QA Insights Dashboard |
|---|---|---|---|
| Failure triage | Manual, per-test | Charts only | AI-classified |
| Run-over-run delta | Hand-compared | Limited | Automatic |
| Flaky-test detection | Tribal knowledge | Rare | Built-in |
| Leadership summary | Written by hand | Not provided | Auto-generated |
| Reporting to team | Copy-paste | Manual export | One-click to Teams |
| Data source setup | Spreadsheets | Custom plumbing | Reads CI/S3 directly |
How Ksolves Can Help Your Team Get There
The thinking behind the AI QA Insights Dashboard reflects Ksolves’ broader approach as an AI-first company that builds intelligent systems to reduce friction for skilled teams, so their expertise goes further and their time is spent where it matters most.

If your team is navigating untriaged failure backlogs, regressions caught too late, flaky tests no one fully trusts, or leadership with no timely read on release risk, those are structural challenges smarter tooling can address.
With Ksolves Quality Assurance Services, you can turn every test run into clear, actionable insight, accelerate triage, and build reporting that fits seamlessly into your existing CI pipeline.
Ready to simplify QA reporting and scale your automation? Contact our AI-certified QA experts today or send us your query at sales@ksolves.com.
Conclusion
Manually reading test results served its purpose for a long time, but the volume and velocity of modern automation have outgrown it. AI-powered analysis offers a path that is faster, more consistent, and accessible to everyone shipping a quality product, from the engineer fixing the failure to the leader deciding whether to release.
By reading runs directly from the pipeline and converting them into triage, trends, and a clear verdict, tools like the AI QA Insights Dashboard let teams act on what their tests are telling them, the moment they finish.
The right tooling and expertise can make a real difference. Let’s connect and discuss!
![]()


Author
About the Author Editorial Team The Ksolves Editorial Team includes certified Salesforce experts, Big Data engineers, AI/ML specialists, Zoho consultants, and experienced technology writers focused on delivering clear, actionable insights for modern businesses. With hands-on experience across Salesforce, Big Data platforms, AI/ML solutions, application development, software testing, and Zoho ERP/CRM, the team publishes practical guides, real-world use cases, and industry updates that support smarter decisions and faster growth. Every article is created to solve business challenges, guide technology adoption, and keep organizations aligned with evolving digital ecosystems.
Share with