

 Odoo
 5 MIN READ


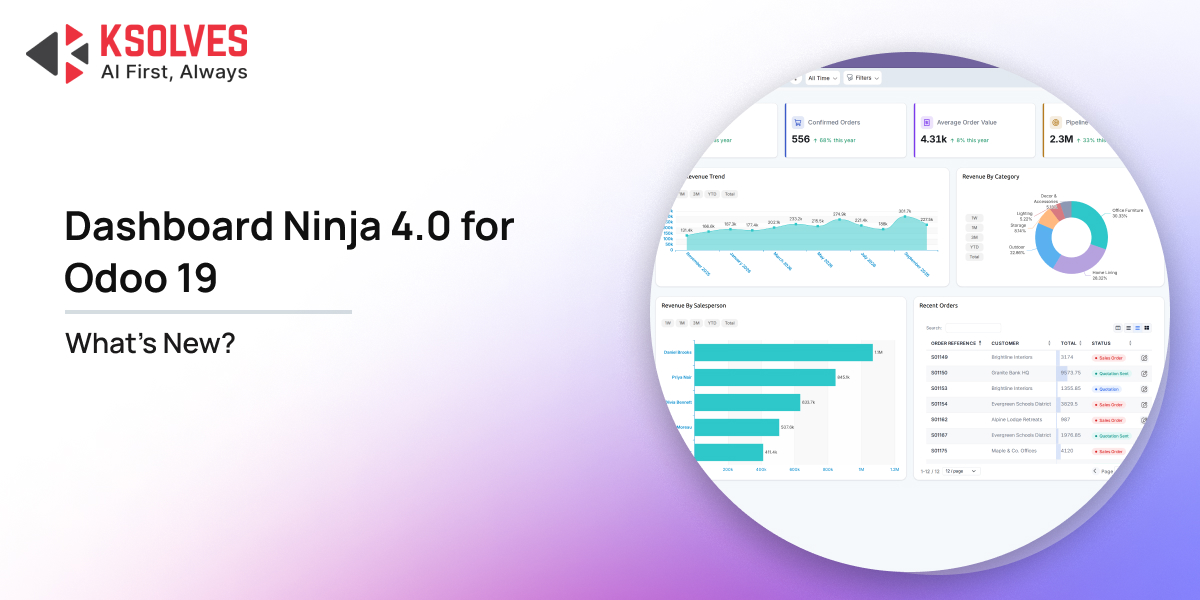
Business data is only useful when teams can understand it, explore it, and act on it. However, creating meaningful dashboards in an ERP system often requires time, multiple configurations, and a clear understanding of reporting tools.
Dashboard Ninja with AI makes this process easier by helping Odoo users bring business metrics, charts, and reports together in one place. With its latest 4.0 release for Odoo 19, the product introduces a redesigned chart engine, 10 new chart types, improved KPI cards, ready-made dashboards, and more flexible ways to explore business data.
The update also brings improvements to dashboard customization, list views, and reporting exports. Together, these changes make it easier for businesses to create dashboards, monitor performance, and understand their Odoo data without constantly building reports from scratch.
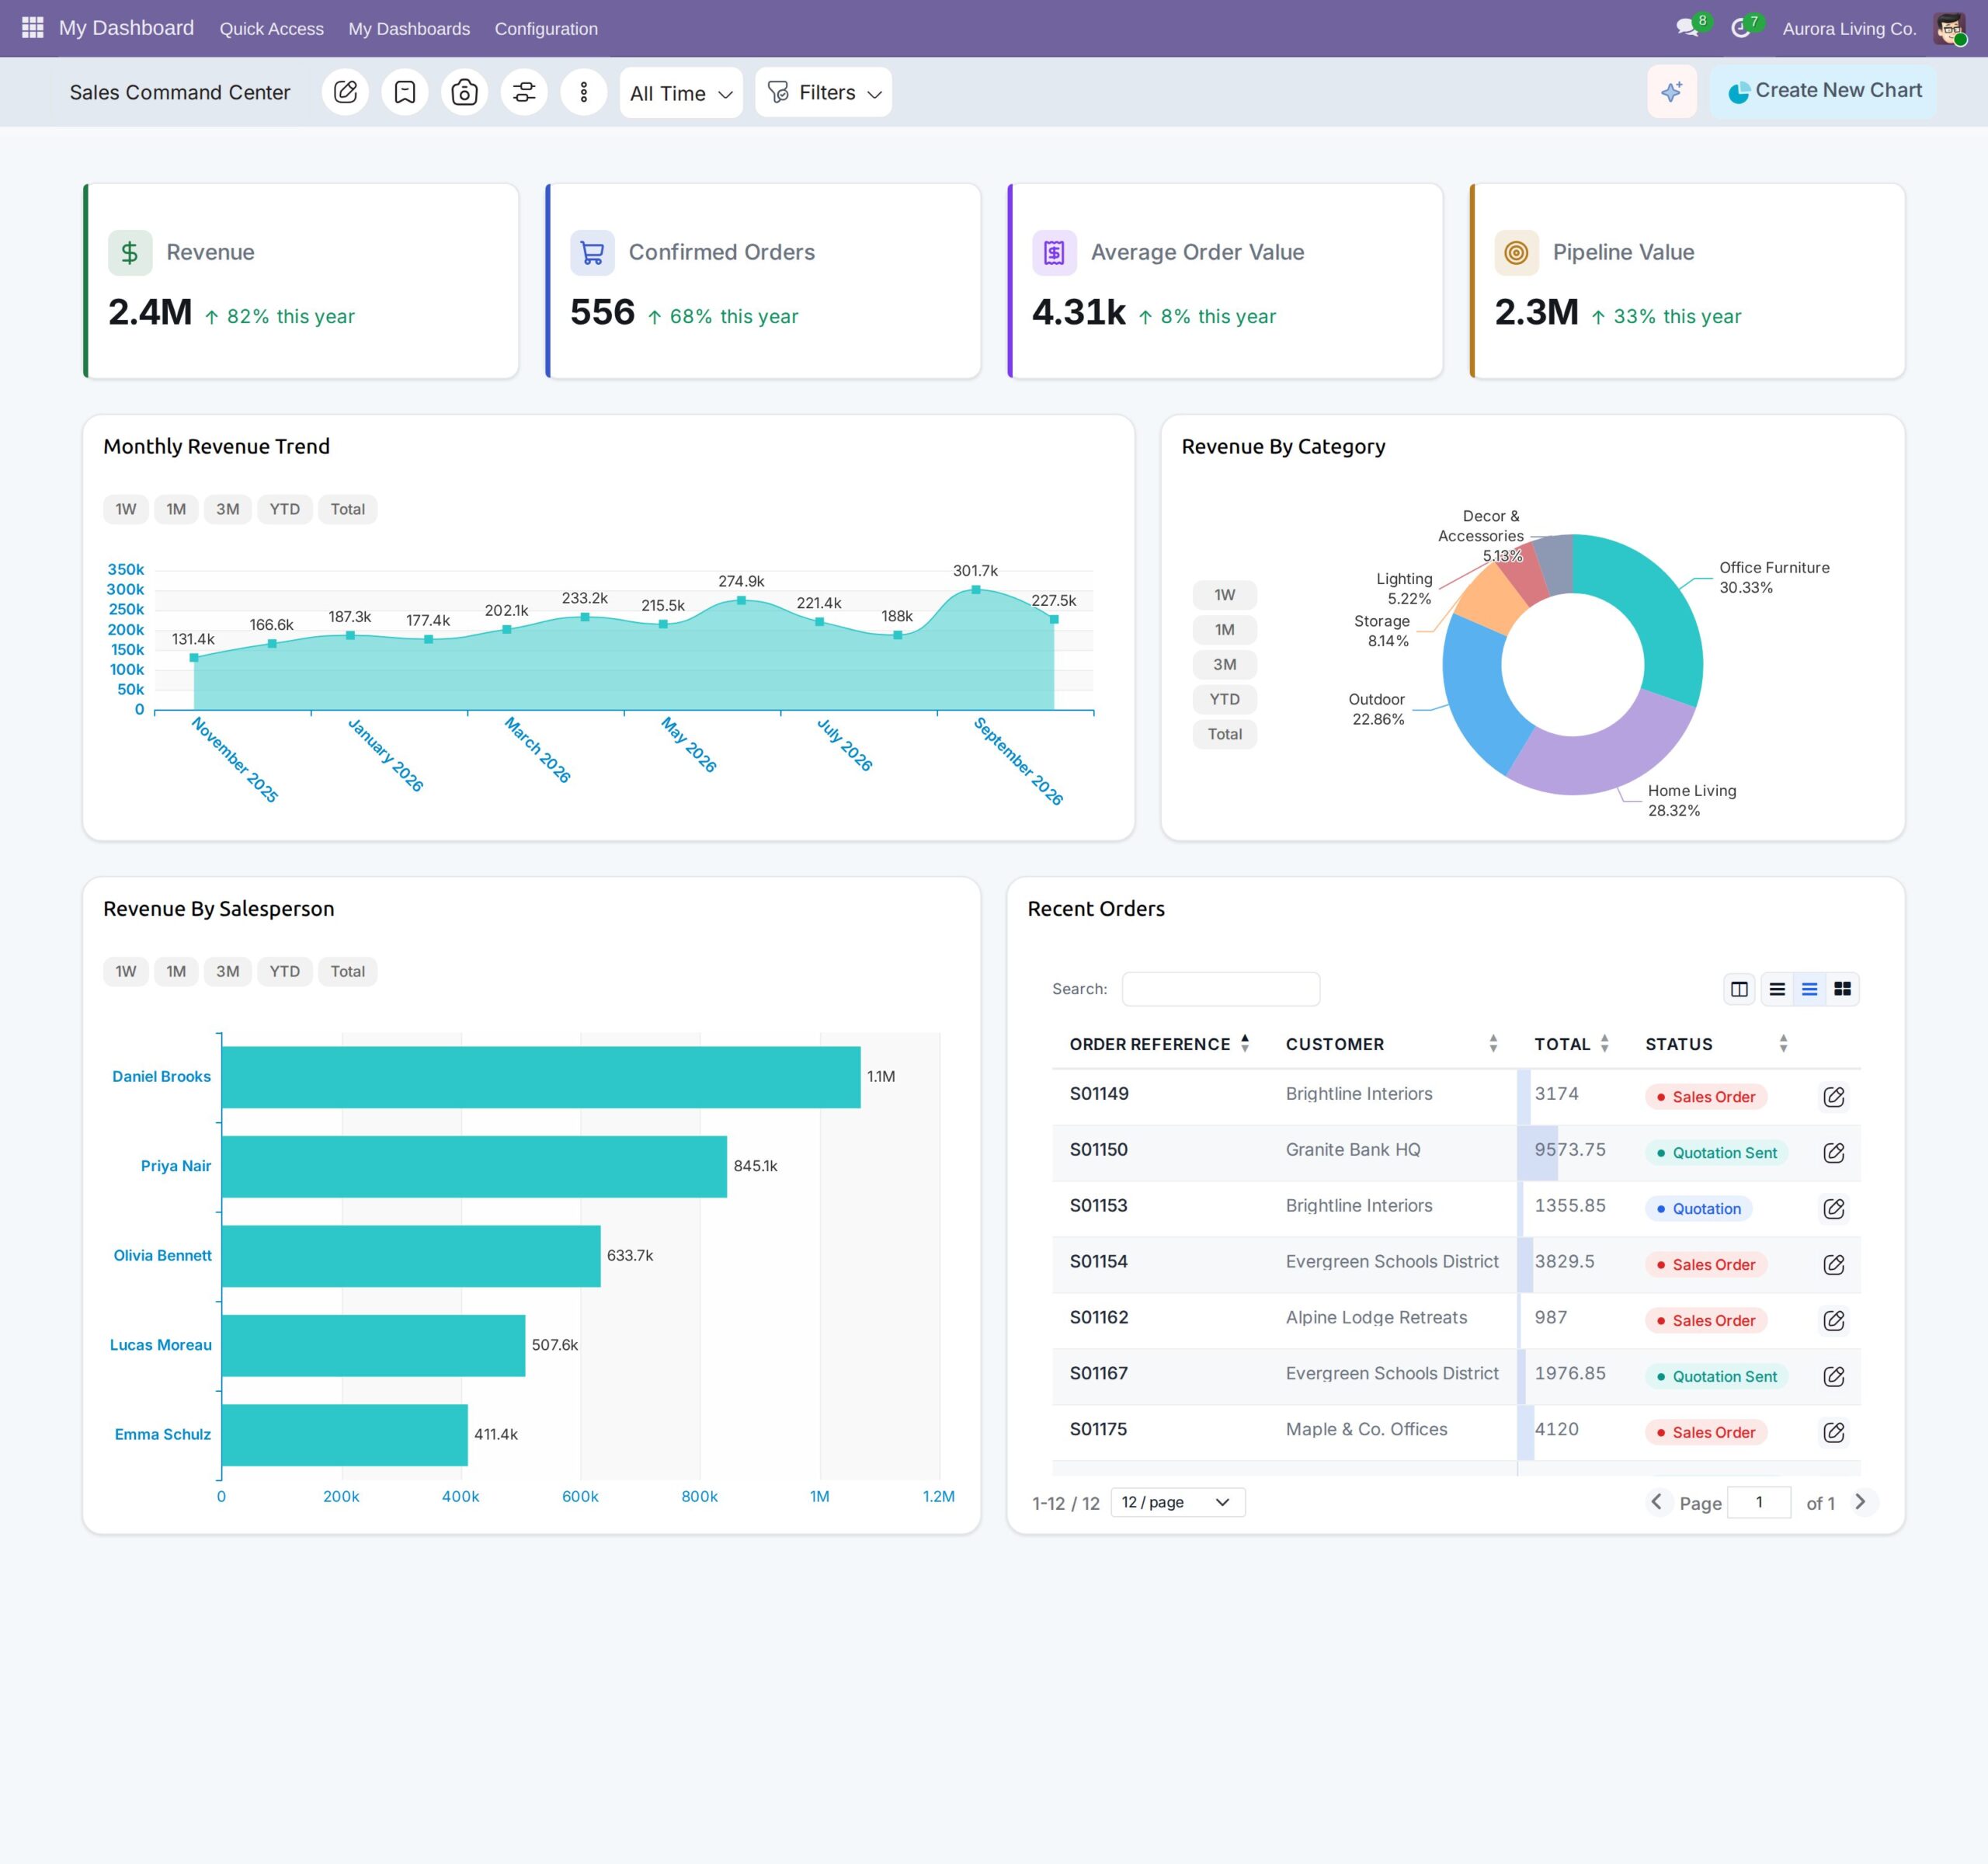
Let’s explore what’s new in Dashboard Ninja with AI 4.0 and how these features improve the overall reporting experience.
What’s New in Dashboard Ninja 4.0 for Odoo 19?
Dashboard Ninja 4.0.0, released on October 19, 2026, introduces several improvements to dashboard creation, visualization, and data exploration.
Here are some of the major updates:
- 30 dashboard item types: Expanded from 18, including 10 new chart types.
- 36 chart colour palettes: More options for customizing dashboard visuals.
- 8 ready-made dashboards: Preconfigured dashboards for major Odoo business functions.
- New Tile and KPI cards: Modern designs with trends, targets, and comparisons.
- Flexible data exploration: Quick date filters and drill-down by any field.
- Redesigned list views: Better searching, sorting, and column customization.
- Advanced Dashboard Ninja 1.1.0: Expanded SQL chart support and external data connectivity.
Let’s look at these improvements in detail.
1. Explore More Business Data with 10 New Chart Types
One of the biggest changes in Dashboard Ninja 4.0 is the introduction of a new chart engine powered by Apache ECharts.
The new engine brings smoother chart animations, better resizing, improved labels, and more visualization options. Dashboard Ninja now offers 30 item types, compared to 18 in the previous version.
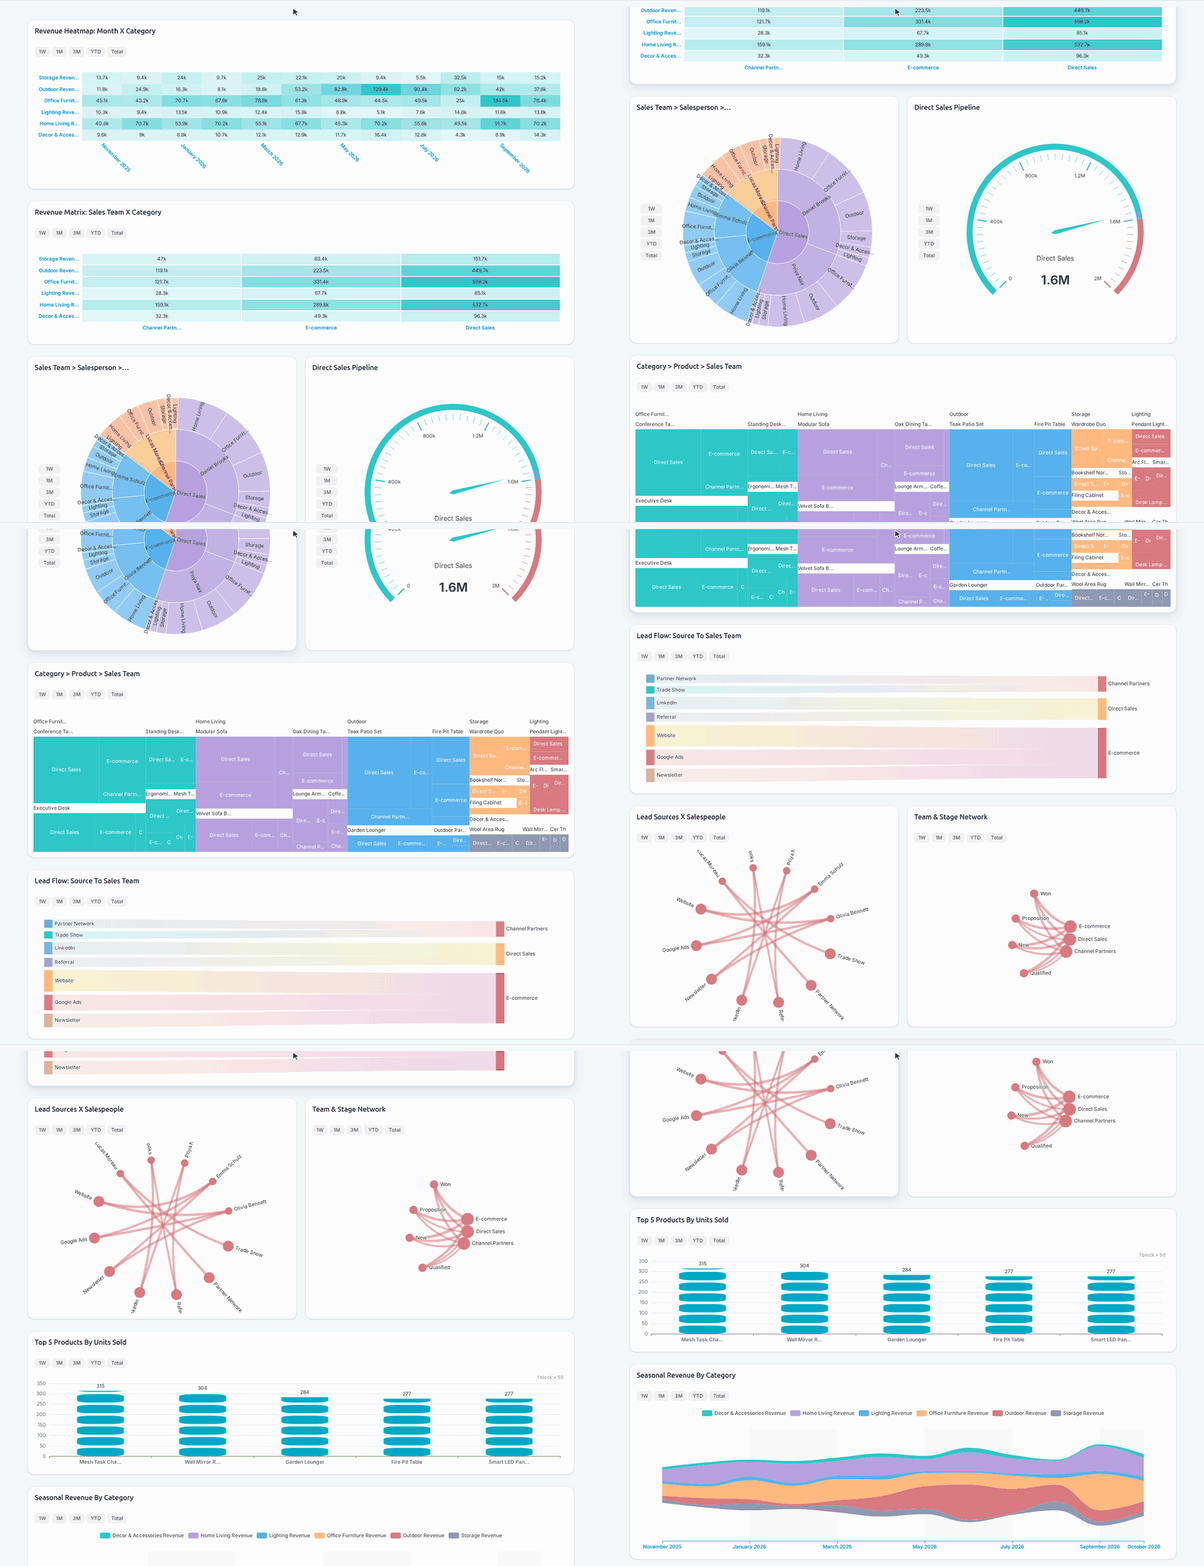
The update introduces 10 new chart types:
| Chart Type | What It Helps Visualize |
|---|---|
| Heatmap | Relationships between two dimensions using colour intensity. |
| Matrix | Numerical comparisons across two dimensions in a grid. |
| Sunburst | Hierarchical data across multiple levels using nested rings. |
| Treemap | Hierarchical information through nested blocks. |
| Gauge | A single metric measured against a defined scale. |
| Sankey | Movement or flow of data between different groups. |
| Chord | Relationships between multiple groups or categories. |
| Graph | Connections between related data points. |
| ThemeRiver | Changes in multiple data streams over time. |
| Pictorial Bar | Comparisons represented through bars made of stacked symbols. |
These chart types help users answer questions that may otherwise require exporting data to spreadsheets or creating separate reports.

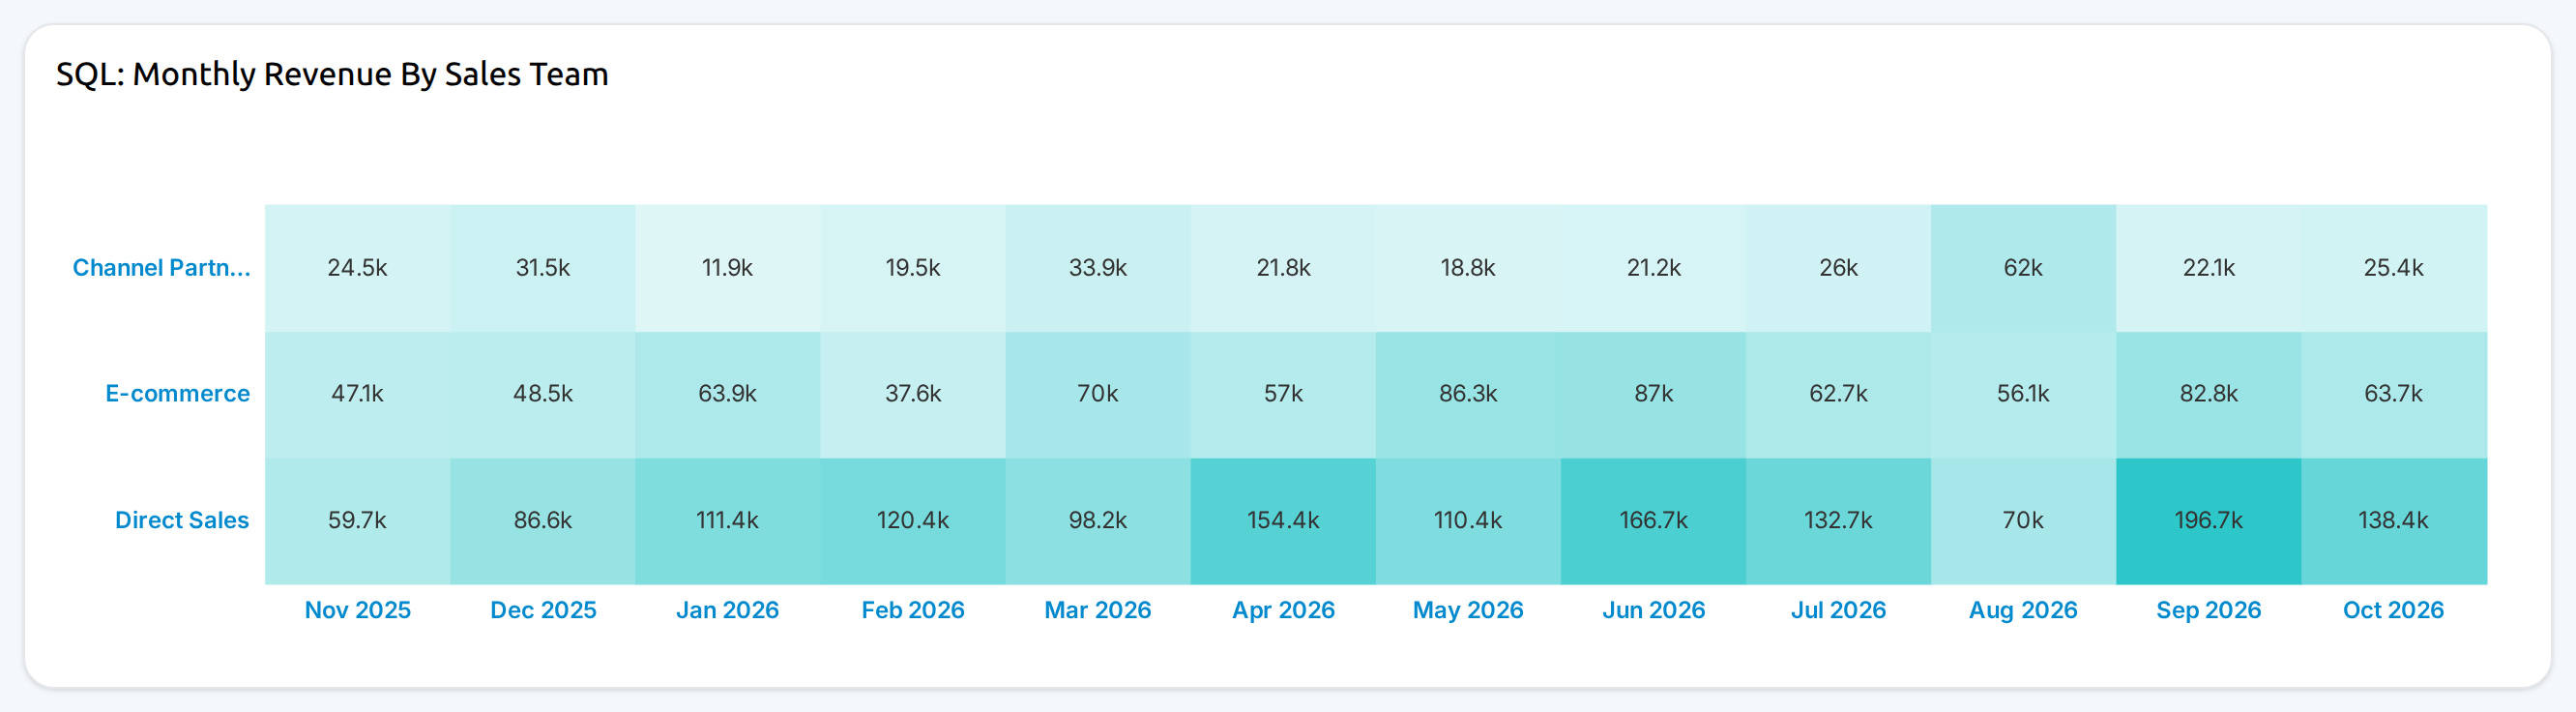
Heatmap: revenue by month and product category |
|

Matrix: revenue by sales team and product category |
|

Sunburst (3 levels): Sales Team → Salesperson → Category |
|

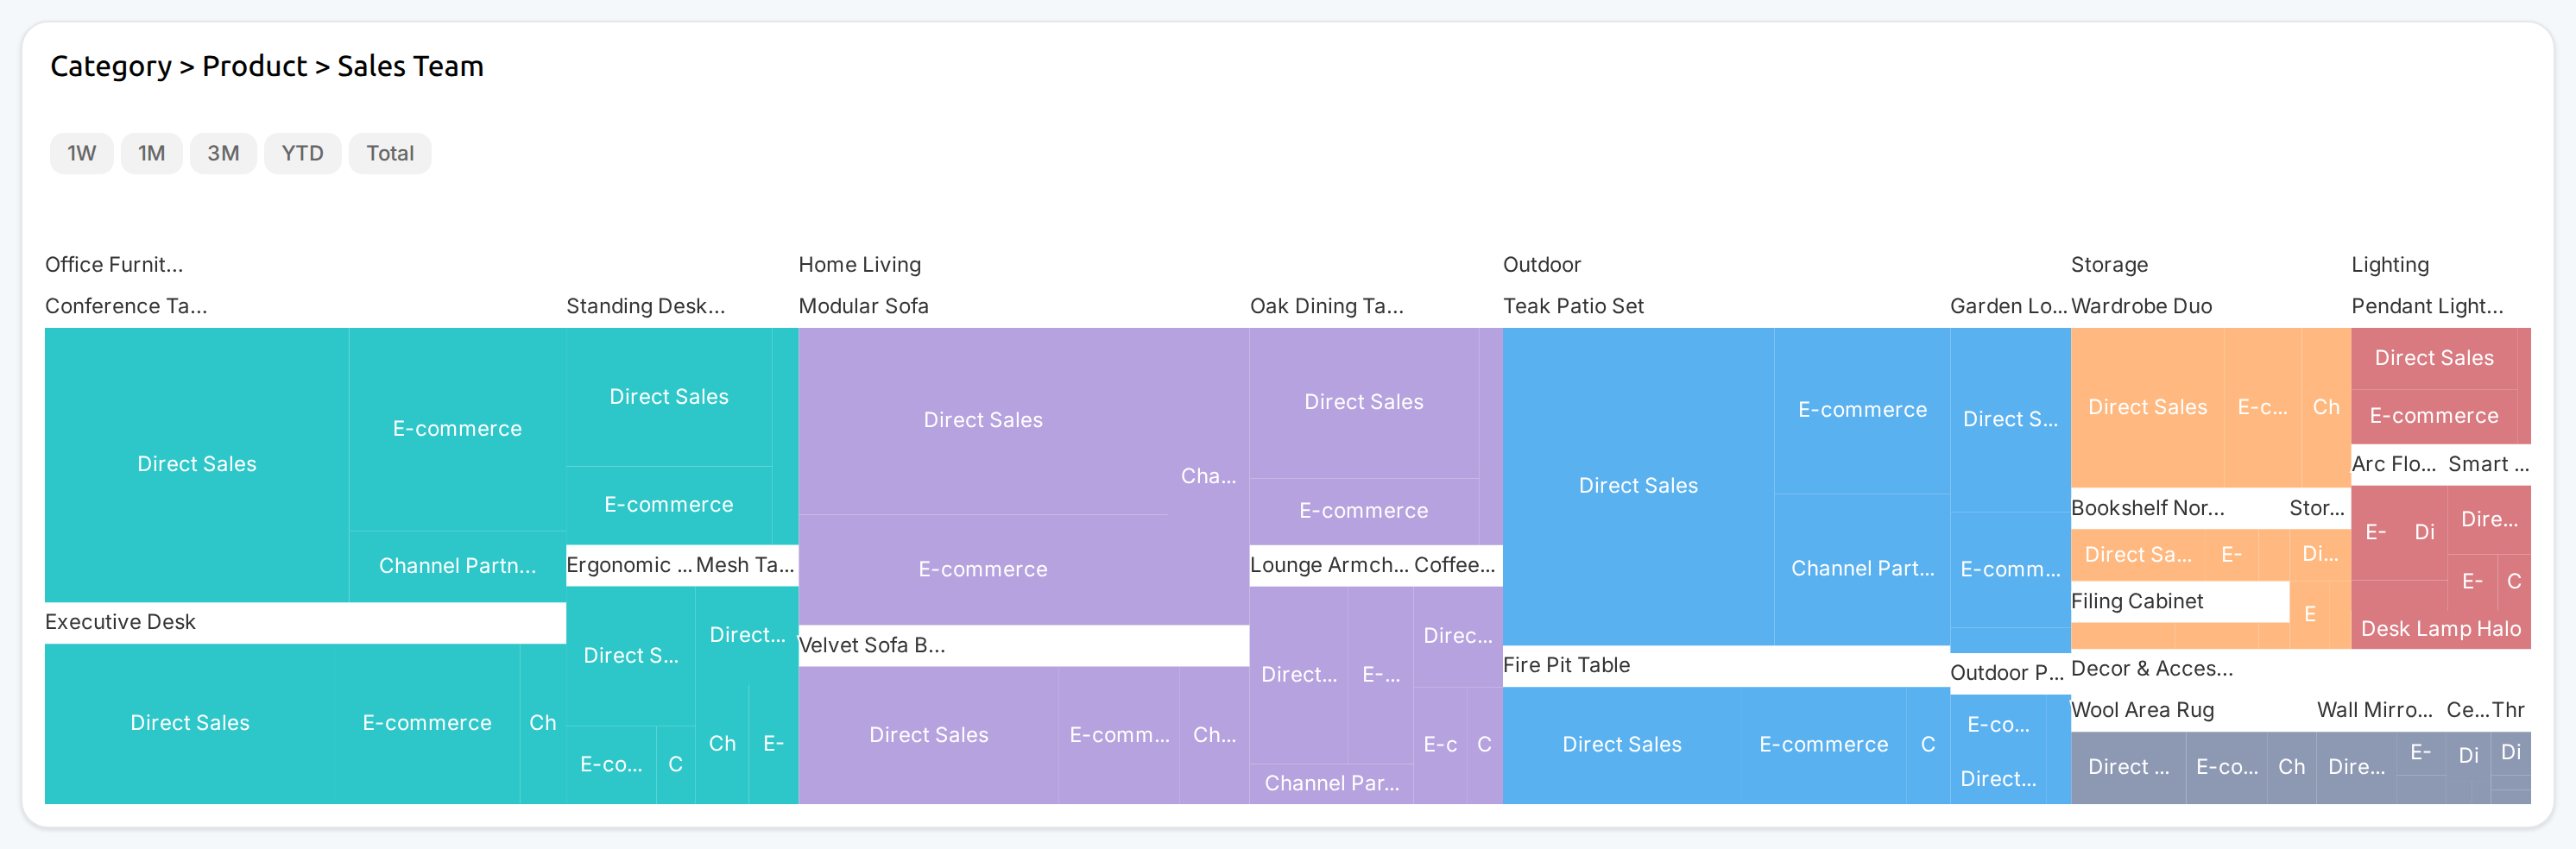
Treemap (3 levels): Category → Product → Sales Team |
|

Sankey: lead flow from source to sales team |
|

Chord: lead sources and salespeople |
|

ThemeRiver: seasonal revenue by category |
|
Three-Level Hierarchy Charts
Dashboard Ninja 4.0 also extends hierarchical visualization through Sunburst and Treemap charts. Previously, hierarchy charts supported two grouping levels. The new update introduces a third Group By level for these two chart types.
For example, users can visualize:
Product Category → Product → Customer
This makes it easier to understand how individual products and customers contribute to broader business categories within a single visualization.
Also Read: Transform the Odoo Experience with the Power of Dashboard Ninja with AI
2. Get Started Faster with 8 Ready-Made Dashboards
Building dashboards from scratch can take time, particularly when different departments need to monitor different business metrics.
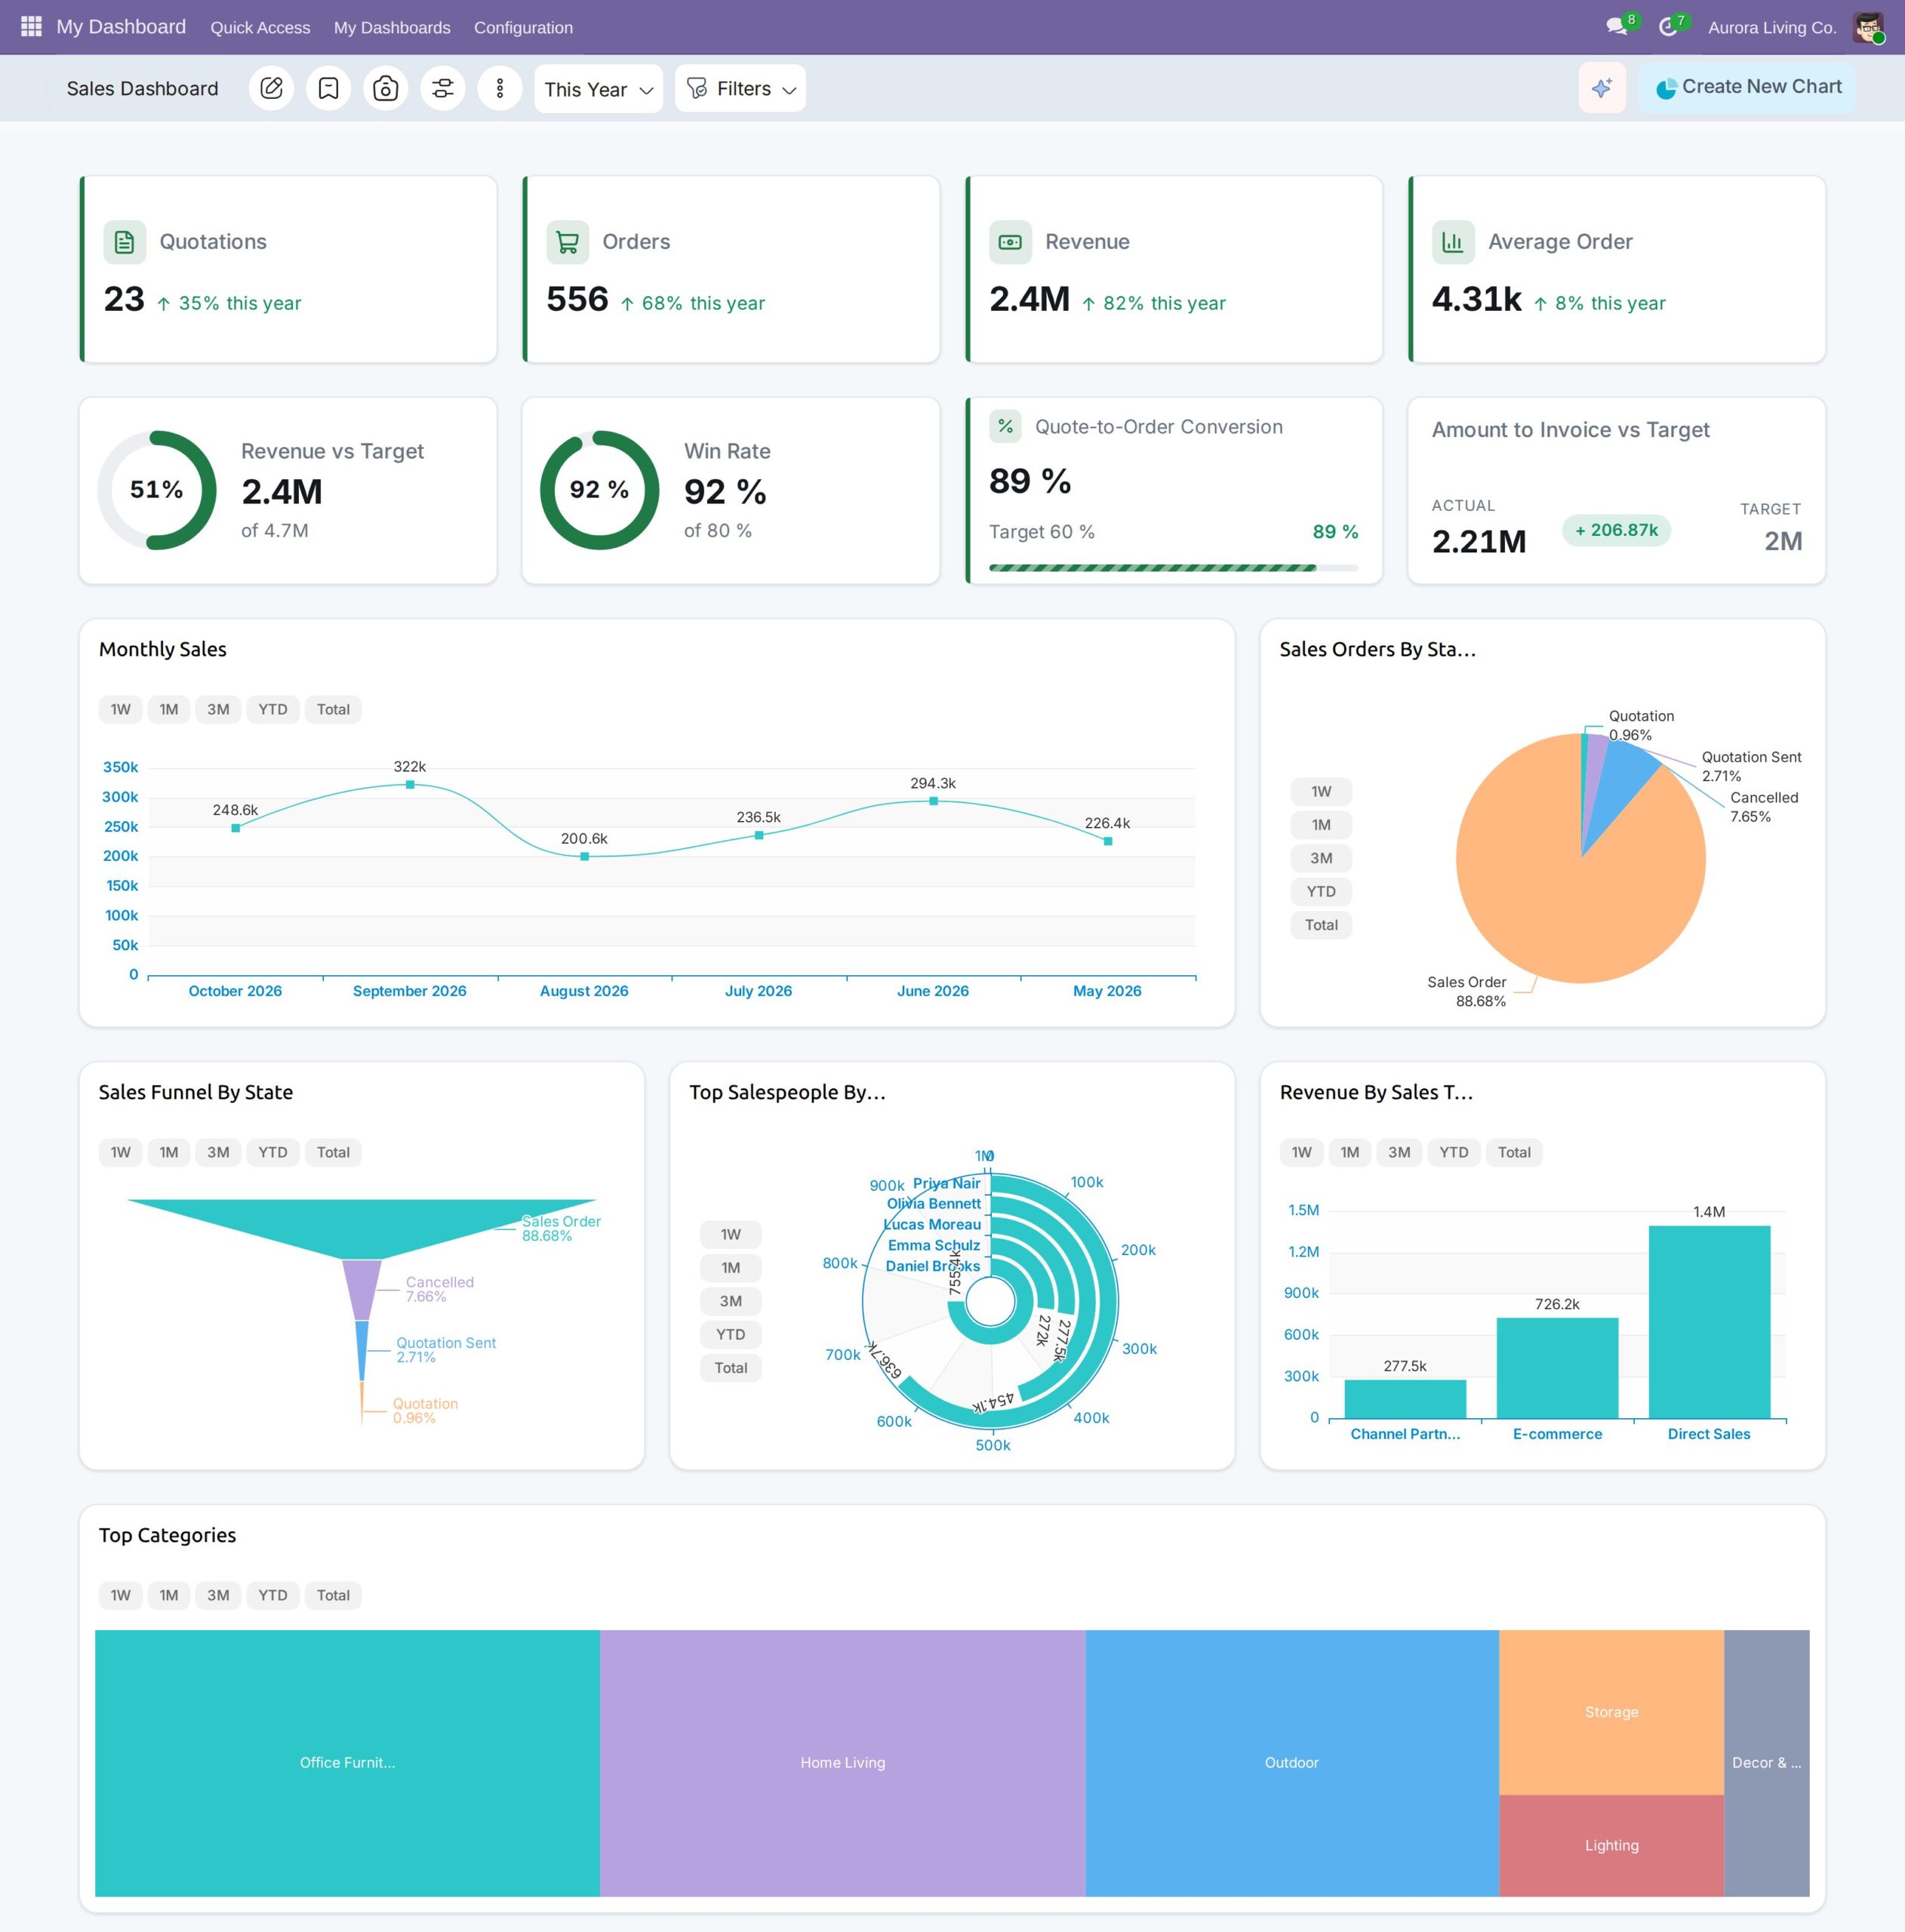
Dashboard Ninja 4.0 addresses this with eight ready-made dashboards that use a company’s existing Odoo data.
The available dashboards cover:
- Sales: Revenue, orders, salespeople, and customer performance.
- Purchase: Purchase orders, supplier spending, and delivery performance.
- Product: Best-selling products, category performance, and sales trends.
- POS: Point-of-sale performance, payment methods, and transaction metrics.
- Leads: Lead sources, campaigns, lost reasons, and conversion metrics.
- Pipeline: Expected closings, pipeline coverage, and opportunity performance.
- Payroll: Department-wise payroll costs and employee metrics.
- Inventory: Receipts, deliveries, stock levels, and warehouse performance.
How Do Ready-Made Dashboards Work?
Users can open a sample dashboard from the dashboard gallery. On its first opening, the dashboard automatically builds itself using the company’s own Odoo data.
It includes relevant KPI cards, trend charts, breakdown charts, and tables.
For example, the Purchase dashboard can display total spending, average order value, monthly purchases, top suppliers, top buyers, cancelled orders, and average lead time.
The first opening takes a few seconds while the dashboard builds. Subsequent openings are instant.
3. Present Business Metrics with New Tile and KPI Cards
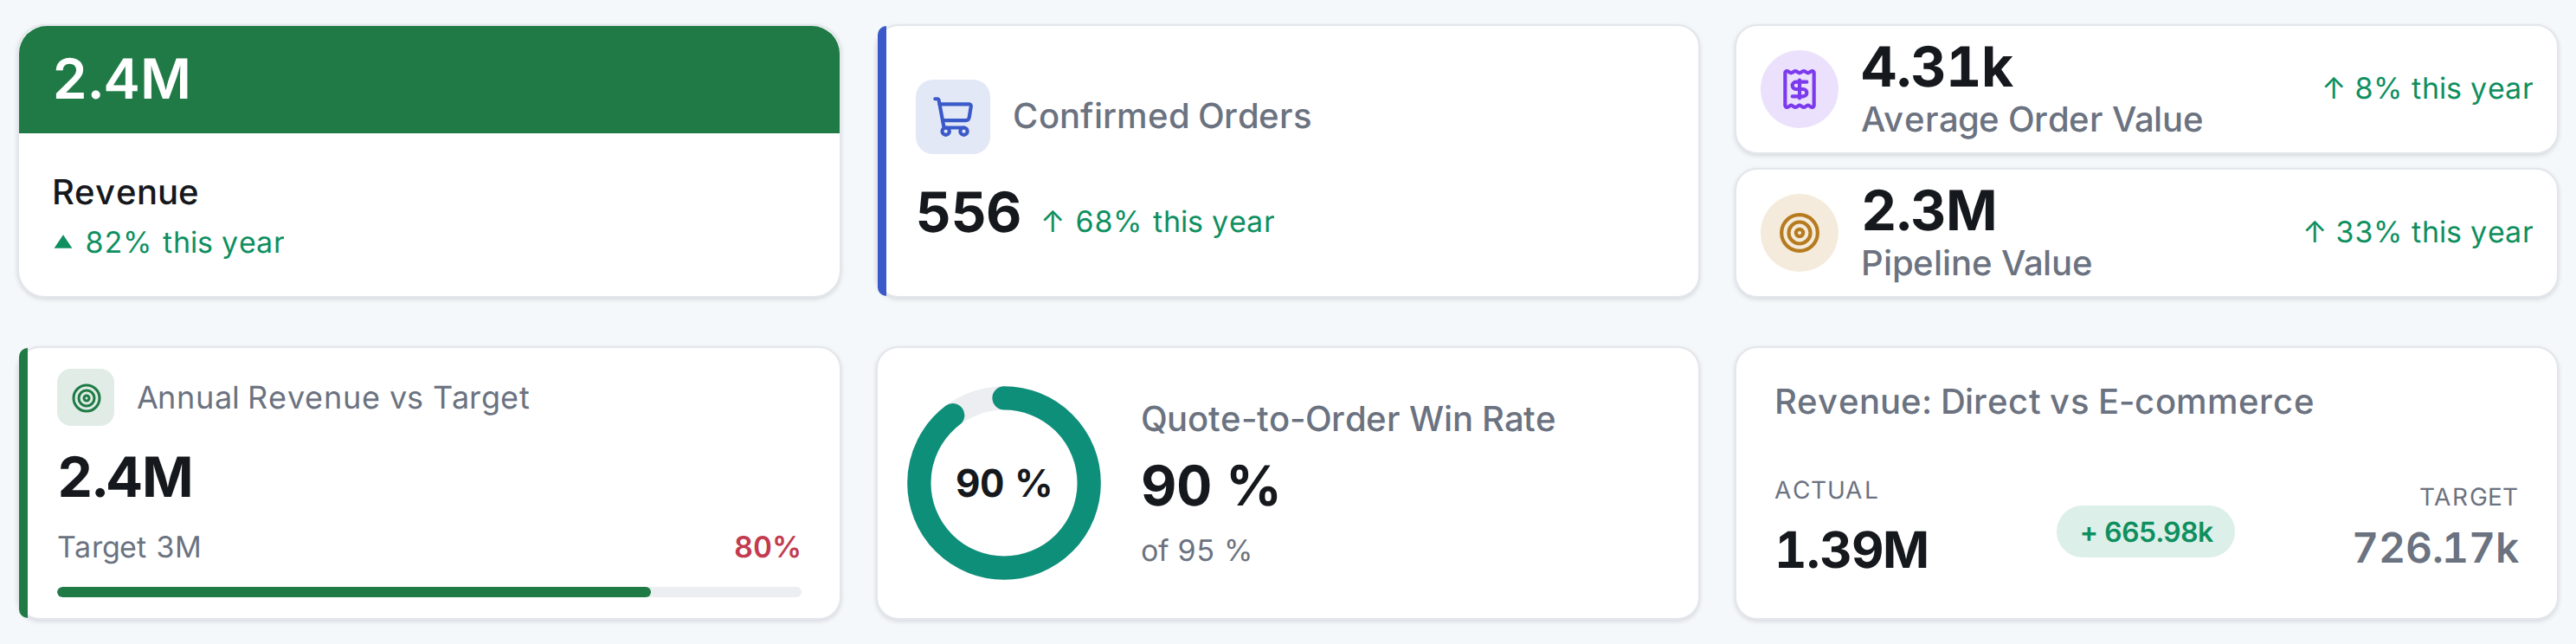
Key business metrics should be easy to identify and understand. Dashboard Ninja 4.0 introduces two redesigned card types to improve how users present important numbers.
a. New Tile Cards
New Tile cards display important business figures along with their trends against the previous period.
When the Compare With Previous Period option is enabled, users can see whether a metric is increasing, decreasing, or remaining steady.
These cards come with three styles:
- Value Plate
- Icon Chip
- Compact Row
The Compact Row style takes up half the height of a regular card, allowing users to arrange more metrics within the same dashboard space.
b. New KPI Cards
New KPI cards help users compare actual values against a target or another value. They offer three presentation styles:
- Linear Progress
- Radial Gauge
- Split Comparison
For example, a business can display monthly revenue against its target using a progress bar or a gauge.
Both new card types support six accent colours: Green, Blue, Teal, Purple, Amber, and Red. They also include a searchable Lucide icon library with 121 icons grouped into 12 business categories.

Also Read: Dashboard Ninja – Transforming Data into Insights for Technology Companies
4. Explore Data with Quick Date Filters and Flexible Drill-Downs
Dashboard Ninja with AI 4.0 improves how users interact with charts and investigate business performance.
Instead of creating separate charts for every reporting period or predefined grouping, users can explore information directly from the dashboard.
a. Quick Date Filters on Individual Charts
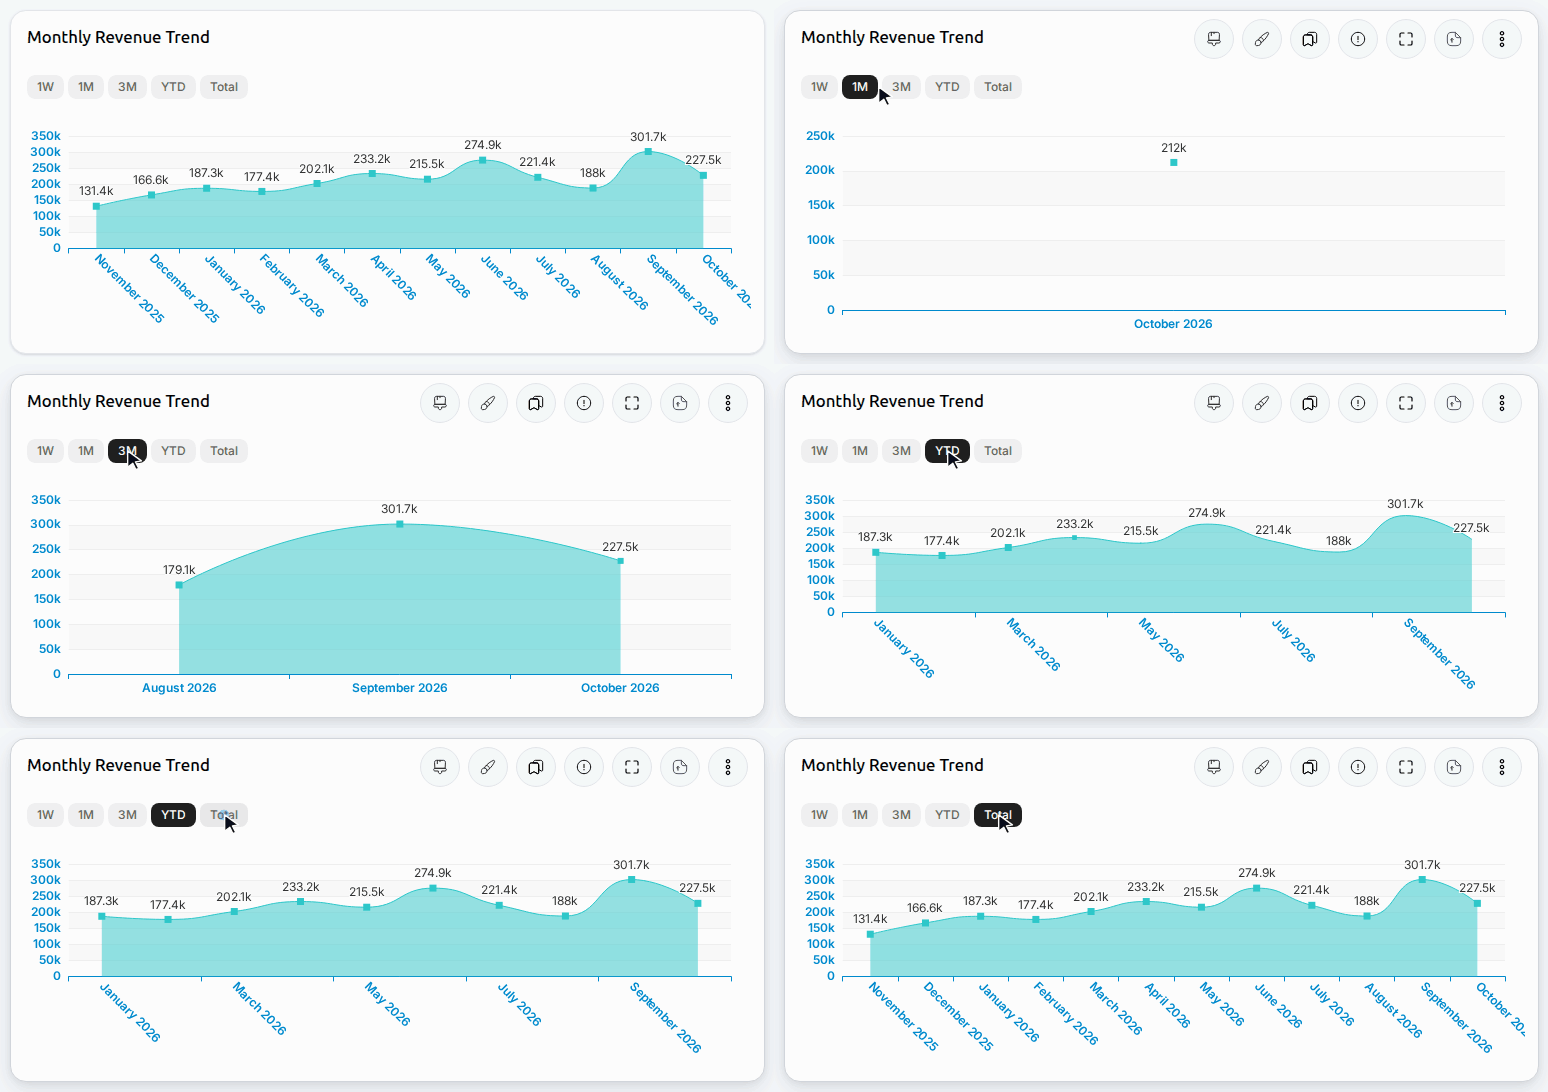
Charts with a configured Date Filter Field now support five quick date filters:
- 1W – Last week
- 1M – Last month
- 3M – Last three months
- YTD – Year to date
- Total – All available data
Users can change the reporting period with a single click.
An important advantage is that these filters work independently for each chart. Changing the date range of one chart does not change the reporting period of the entire dashboard.
For example, a sales manager can view the year-to-date revenue on one chart while checking last month’s order performance on another.
This makes it easier to compare different reporting periods within the same dashboard.
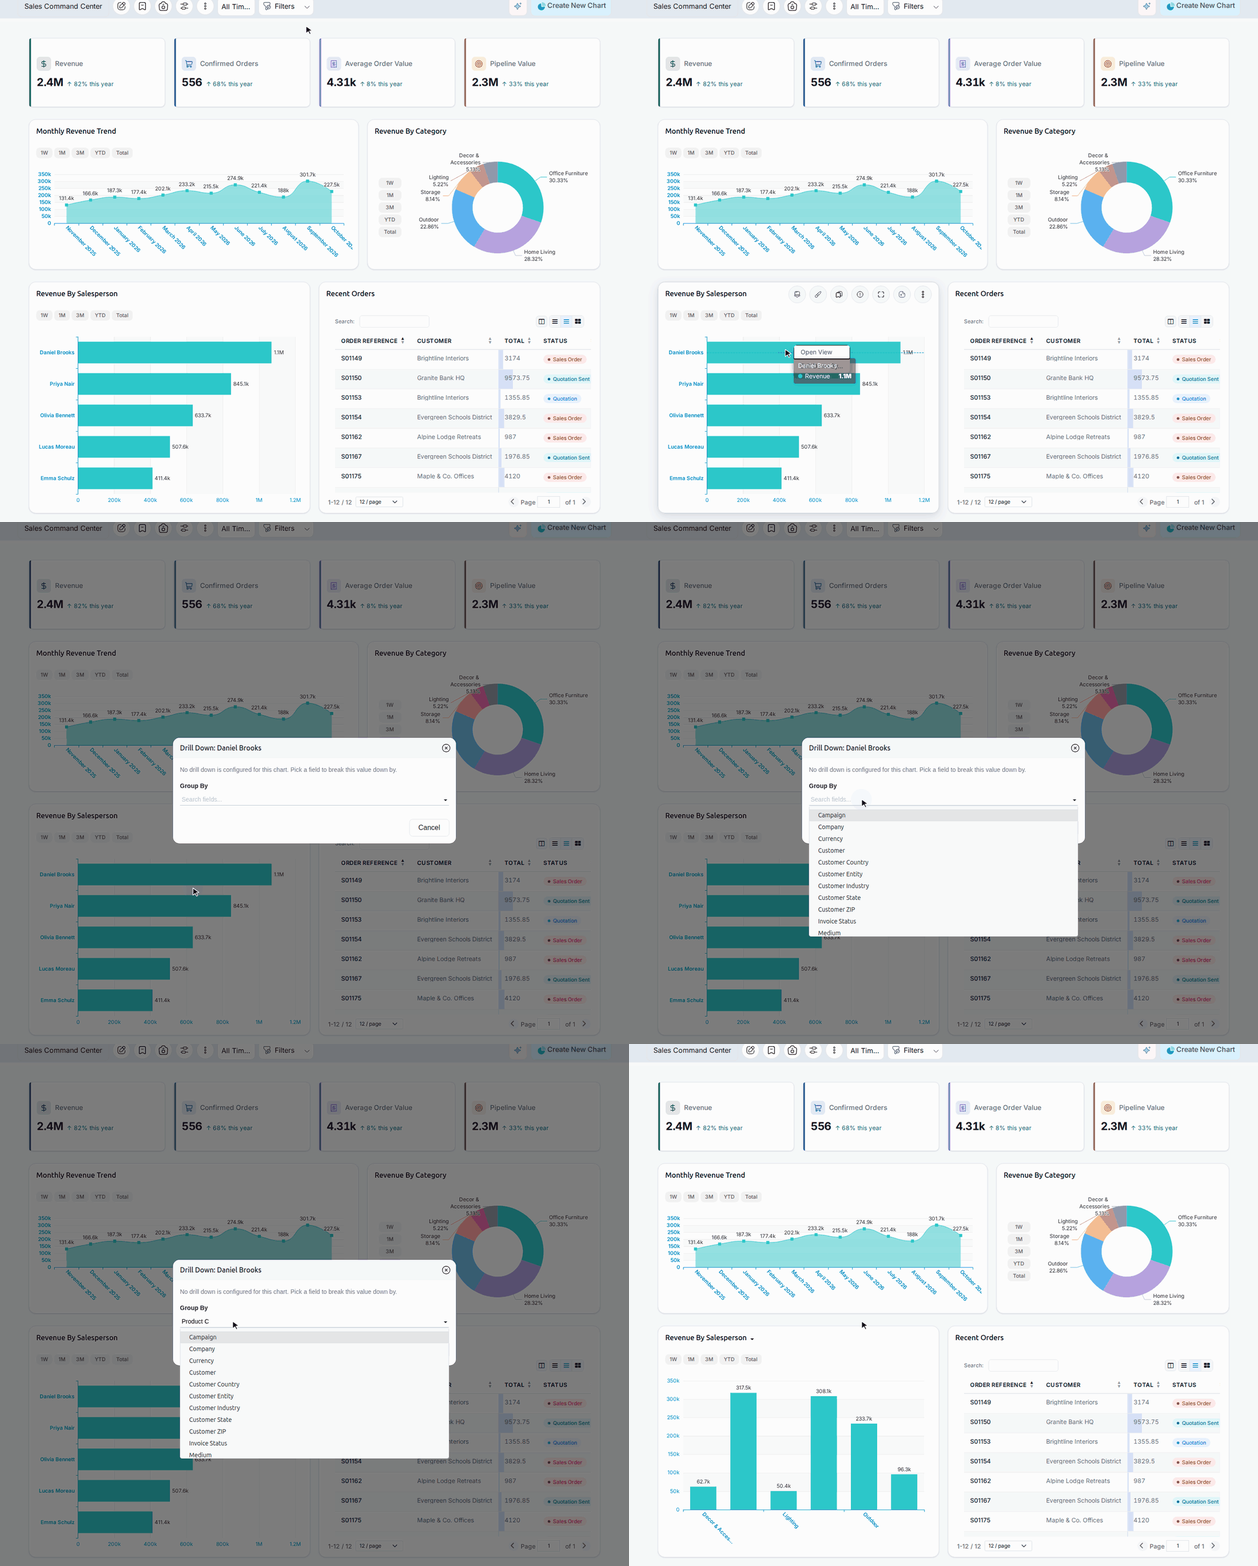
b. Drill Down by Any Field
Another important improvement is the ability to drill down into chart data using any available field without configuring the drill-down levels in advance.
When users click a chart bar, slice, or data point, a menu appears with options such as:
- Open View
- Drill Down
- Drill Down By
- Change Drill Down Field
- Drill To Top
For example, a user analyzing monthly revenue can select a particular month and choose Salesperson as the next grouping field.
The chart then displays the sales performance by salesperson.
Users can also change the grouping field to Product and explore the same data from another perspective.
Previously, drill-down was limited to levels configured in advance. With Dashboard Ninja 4.0, users have more flexibility to investigate data and answer follow-up questions without requesting a new report every time.
5. Work More Efficiently with the Redesigned List View
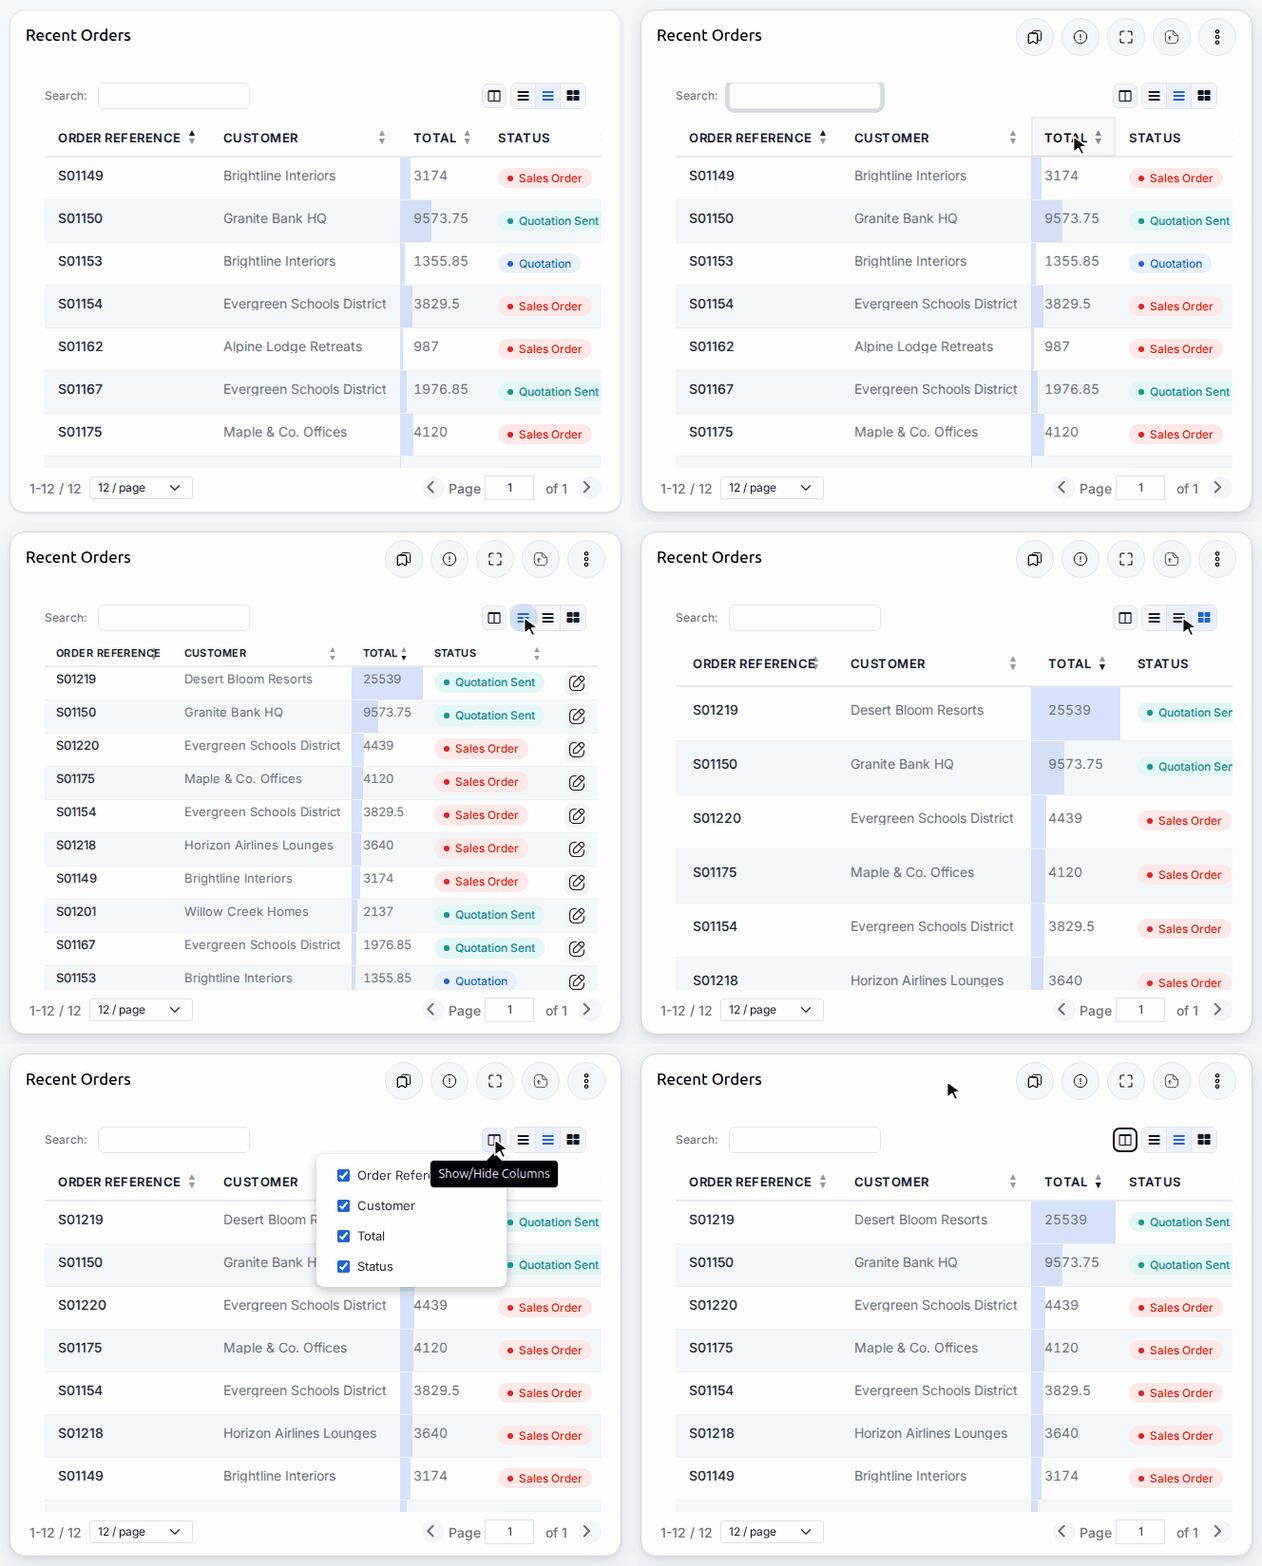
Dashboard Ninja 4.0 redesigns the list view to make dashboard tables more interactive and easier to work with. The updated list view includes:
- Search within lists: Find specific records without navigating away from the dashboard.
- Column sorting: Sort information using any available column.
- Column reordering: Drag and rearrange columns based on reporting requirements.
- Show or hide columns: Customize which information appears in the list.
- Row density controls: Switch between compact and comfortable layouts.
- Page size settings: Choose how many records appear on each page.
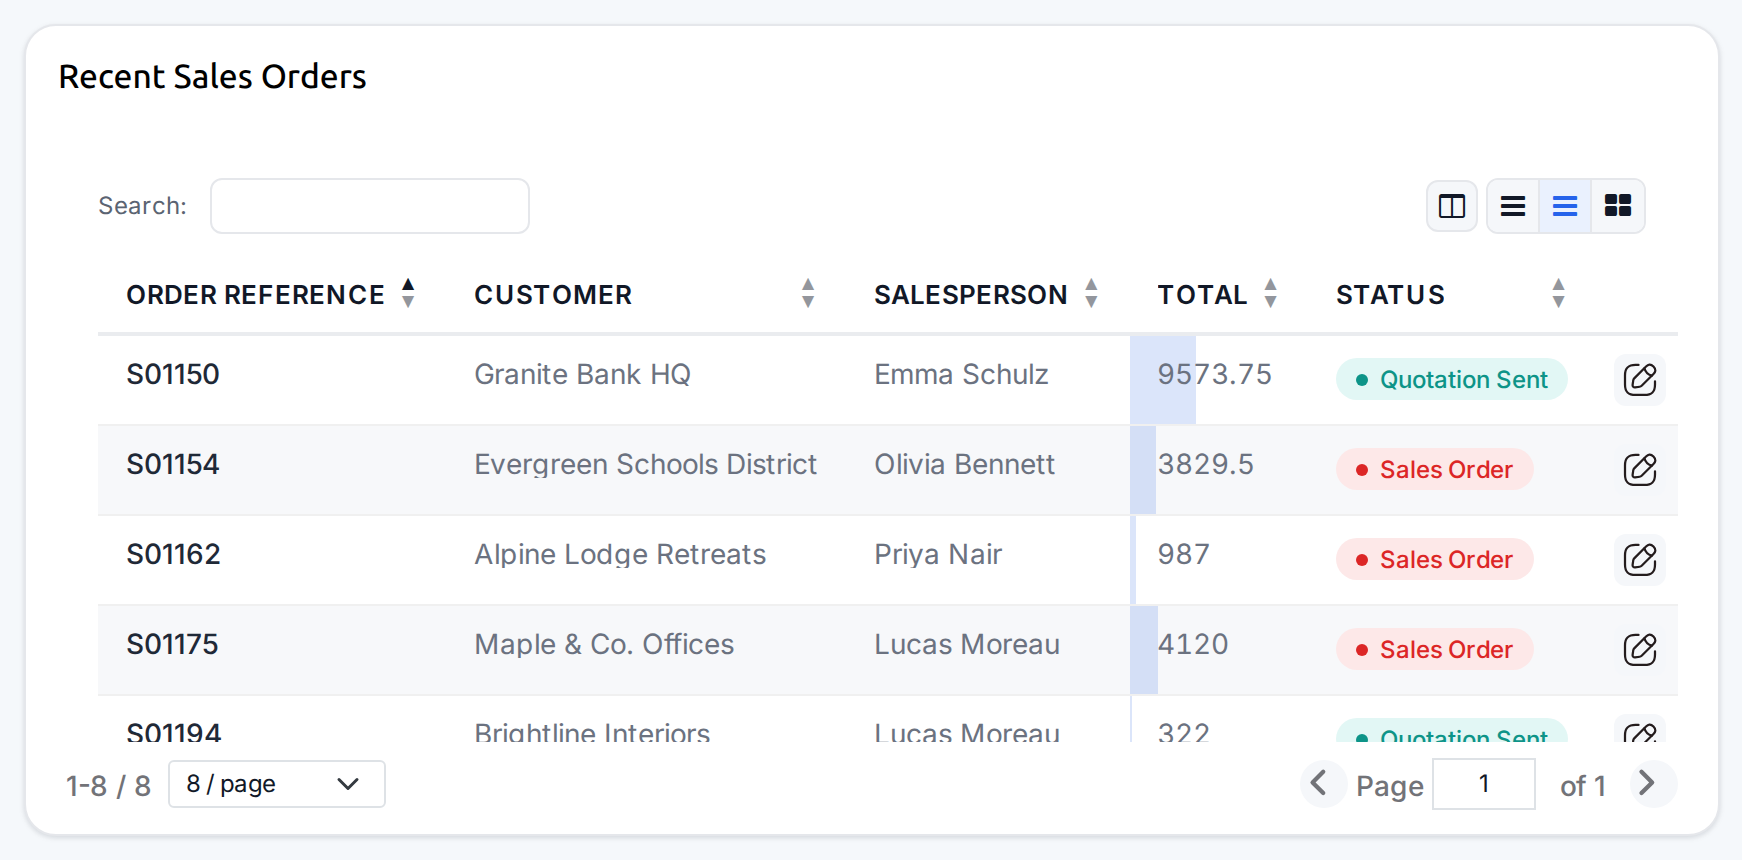
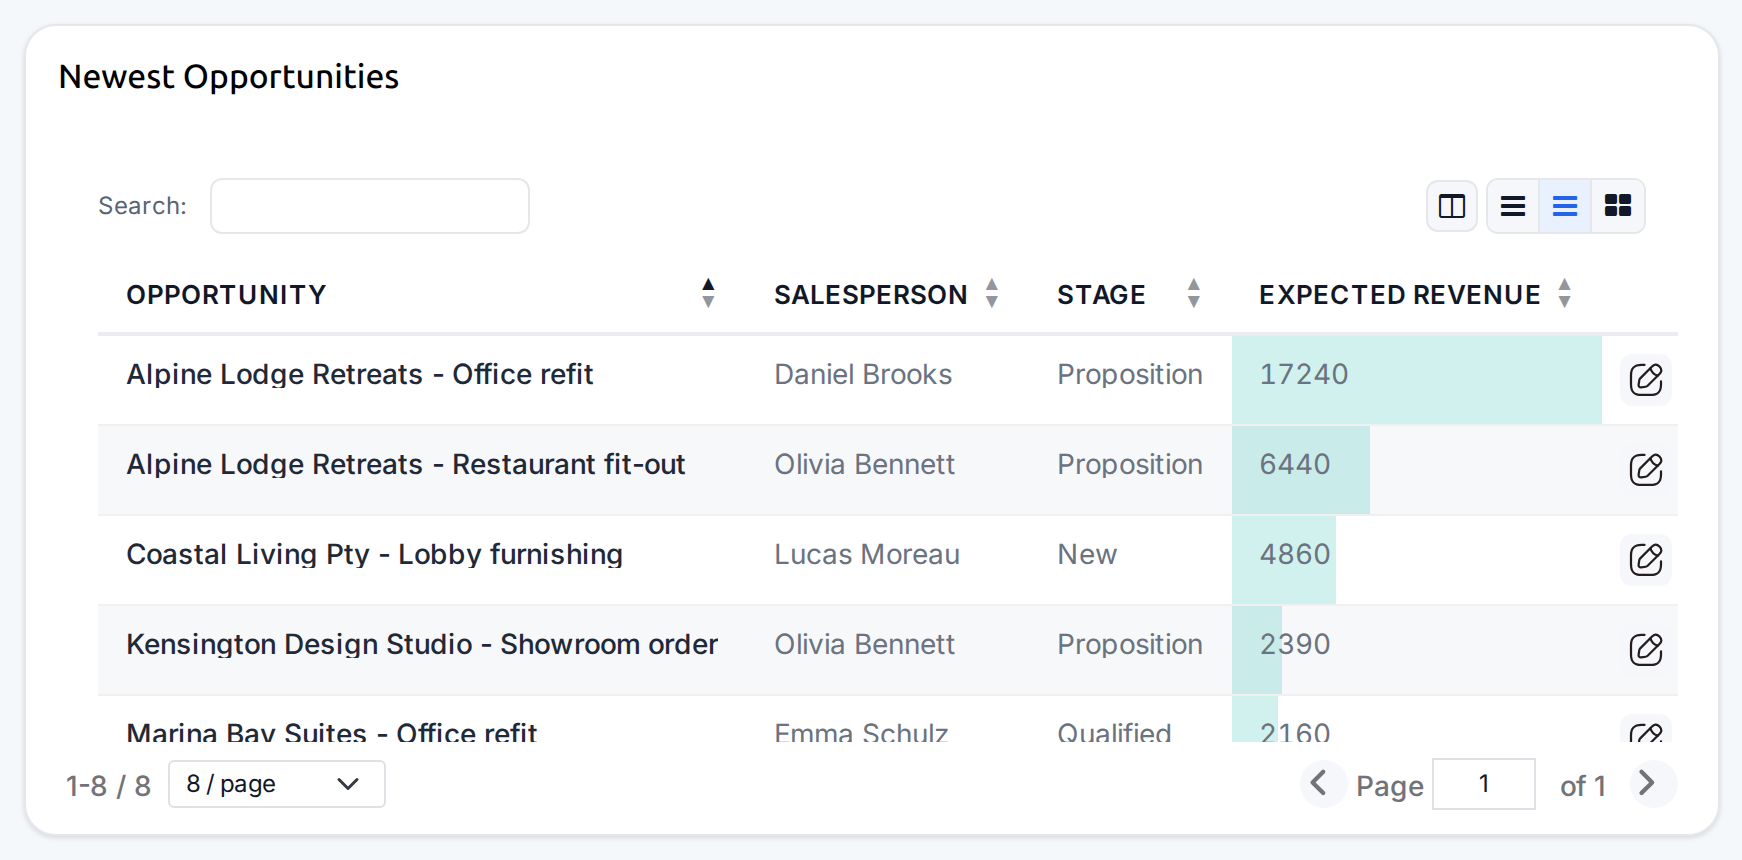
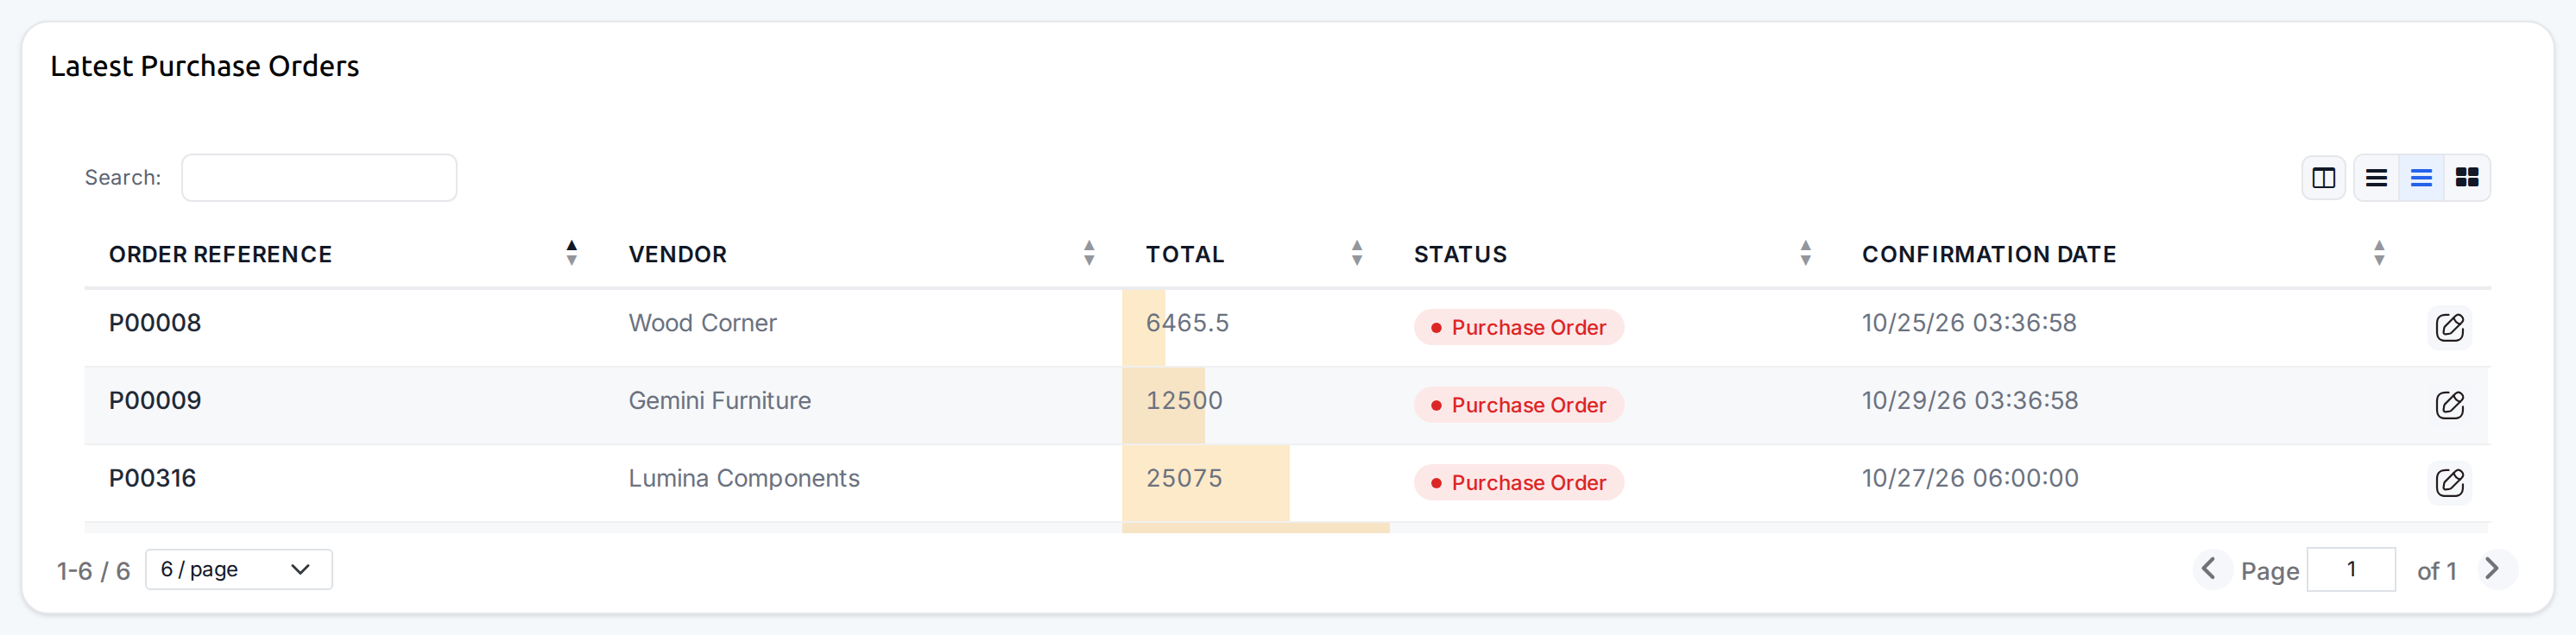
- Value bars: Display visual bars behind numeric values in ungrouped lists.
- Status pills: Highlight record statuses using coloured labels.
- Full-cell content: Click truncated cells to view their complete text.
- Expanded list view: Open lists in a larger window for easier analysis.
Another useful improvement is that individual viewers’ list preferences are remembered in their browsers.
|
List: recent sales orders with value bars and status labels |
|
|
List: newest opportunities with expected-revenue bars |
|
|
List: latest purchase orders with value bars and status labels |
Also Read: How Dashboard Ninja with AI Revolutionized KPI Visibility in Retail
6. Create Dashboards Faster with Templates and Previews
In Dashboard Ninja 4.0, all eight sample dashboards can also be used as templates.
When creating a dashboard, users can select a template and preview its layout before creating it. Templates associated with Odoo applications that are not installed are automatically hidden.
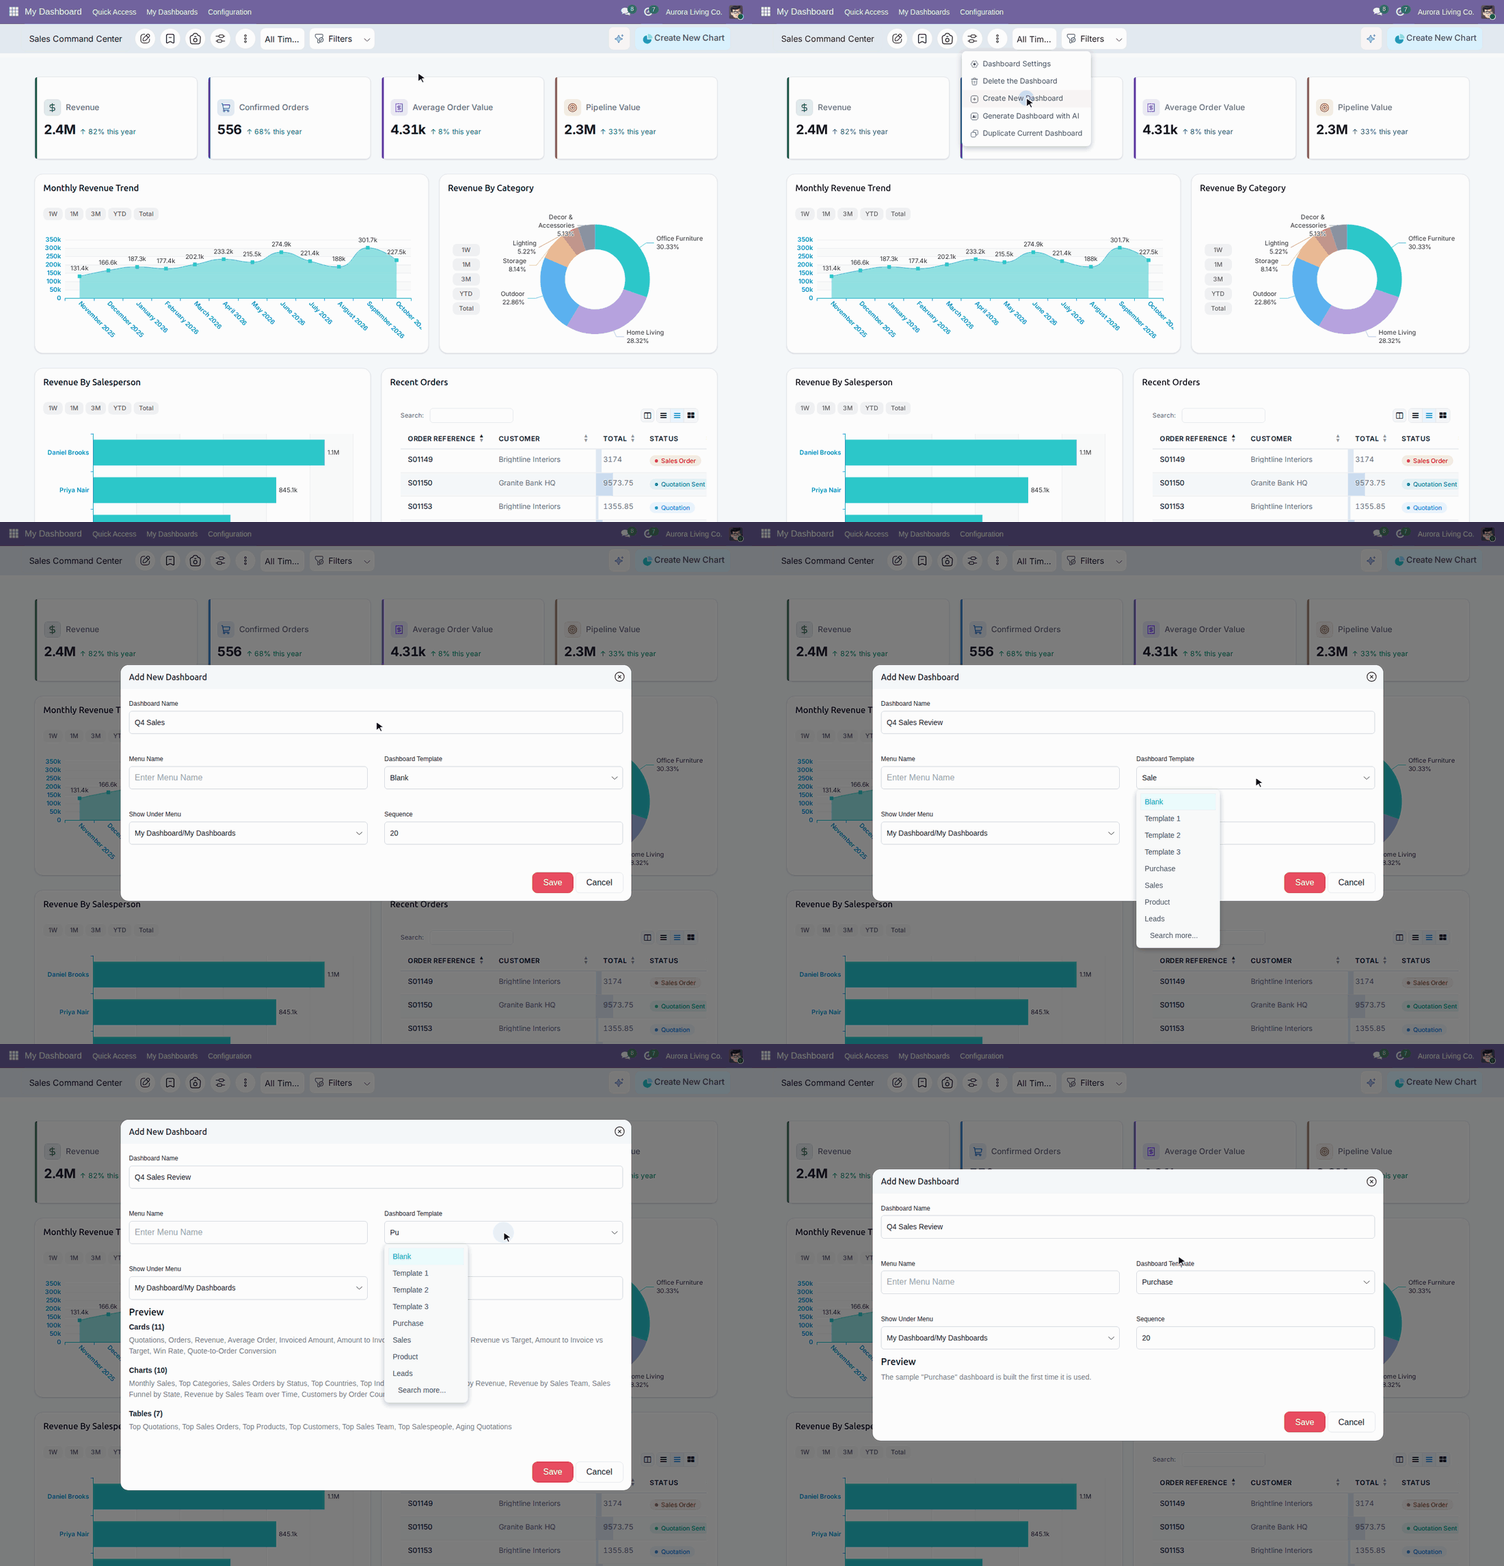
The update also improves the Duplicate Dashboard functionality. When users duplicate a dashboard, its items and layout are copied exactly. This makes it easier to create similar dashboards for different departments or reporting requirements.
For example, a business can use its existing Sales dashboard as a starting point for a new department-specific dashboard and customize the required metrics.
These improvements reduce repetitive configuration and make dashboard creation more straightforward.
7. Export, Share, and Present Dashboard Reports More Reliably
Business reporting does not always happen inside an ERP system. Teams often need to share information with management, prepare board reports, or review metrics during meetings.
Dashboard Ninja 4.0 improves its existing export and reporting capabilities.
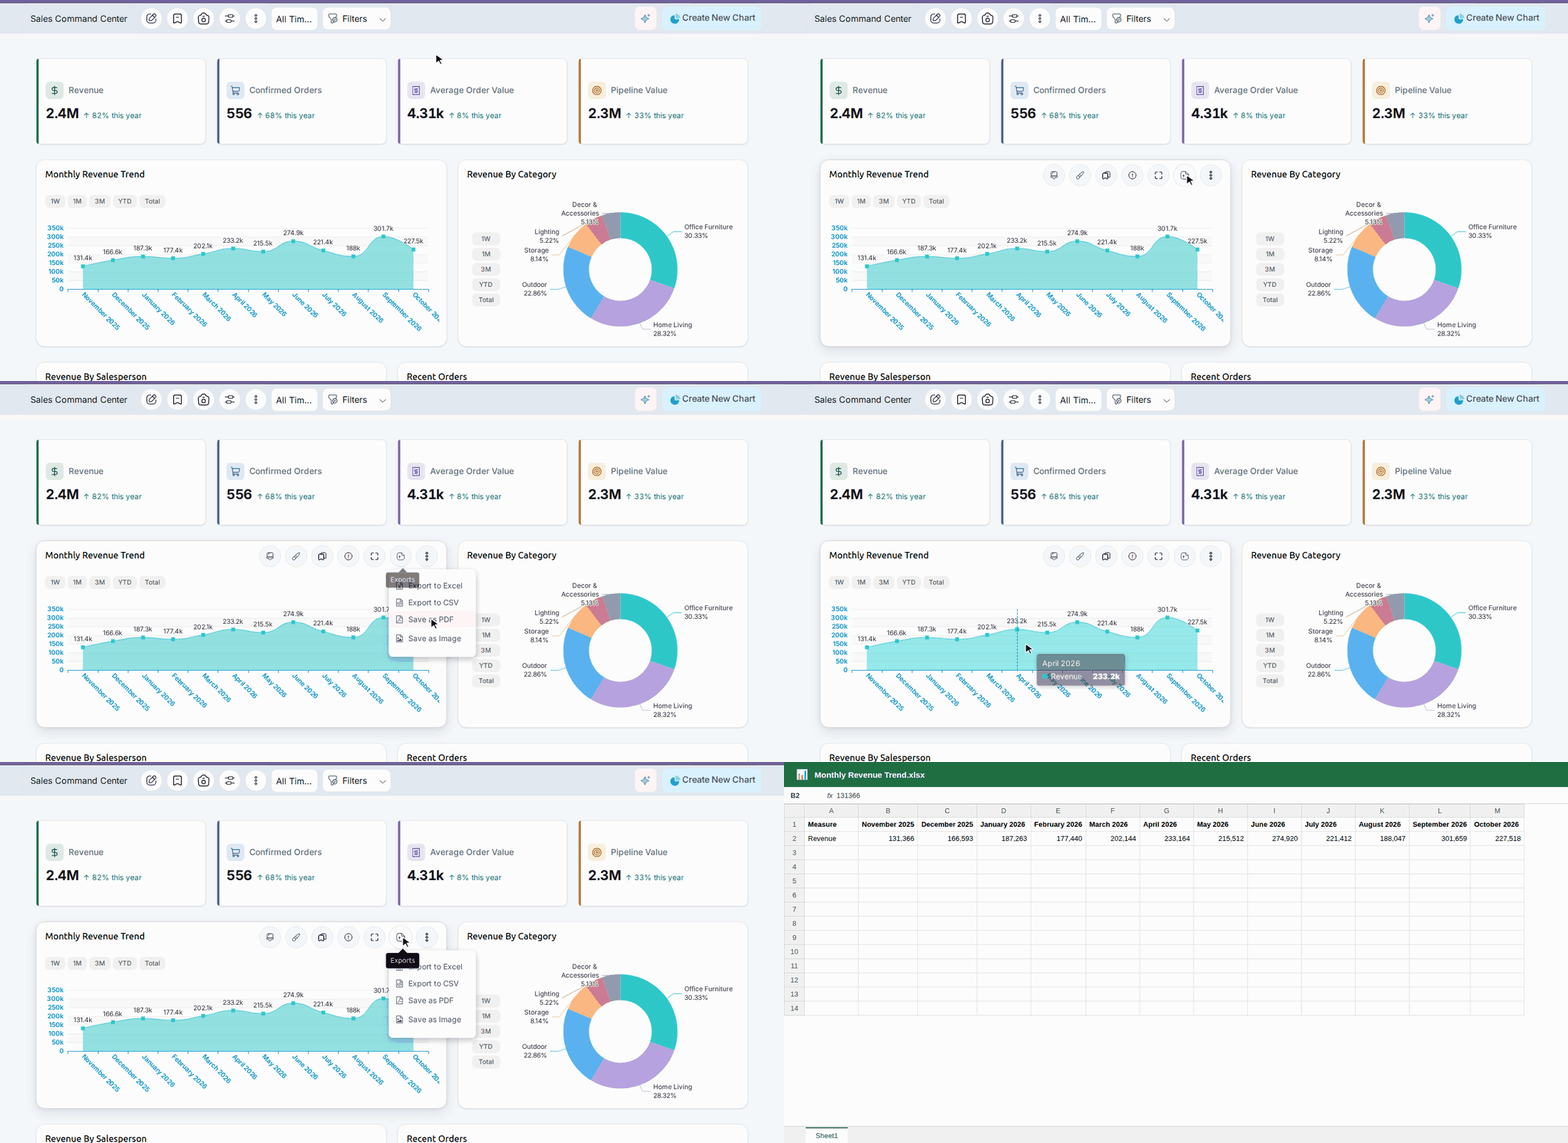
- Improved Chart Exports
Users can export charts into PDF and PNG formats. The exported files are captured directly from the charts, helping them match the dashboard’s visual presentation. - Better Excel Exports
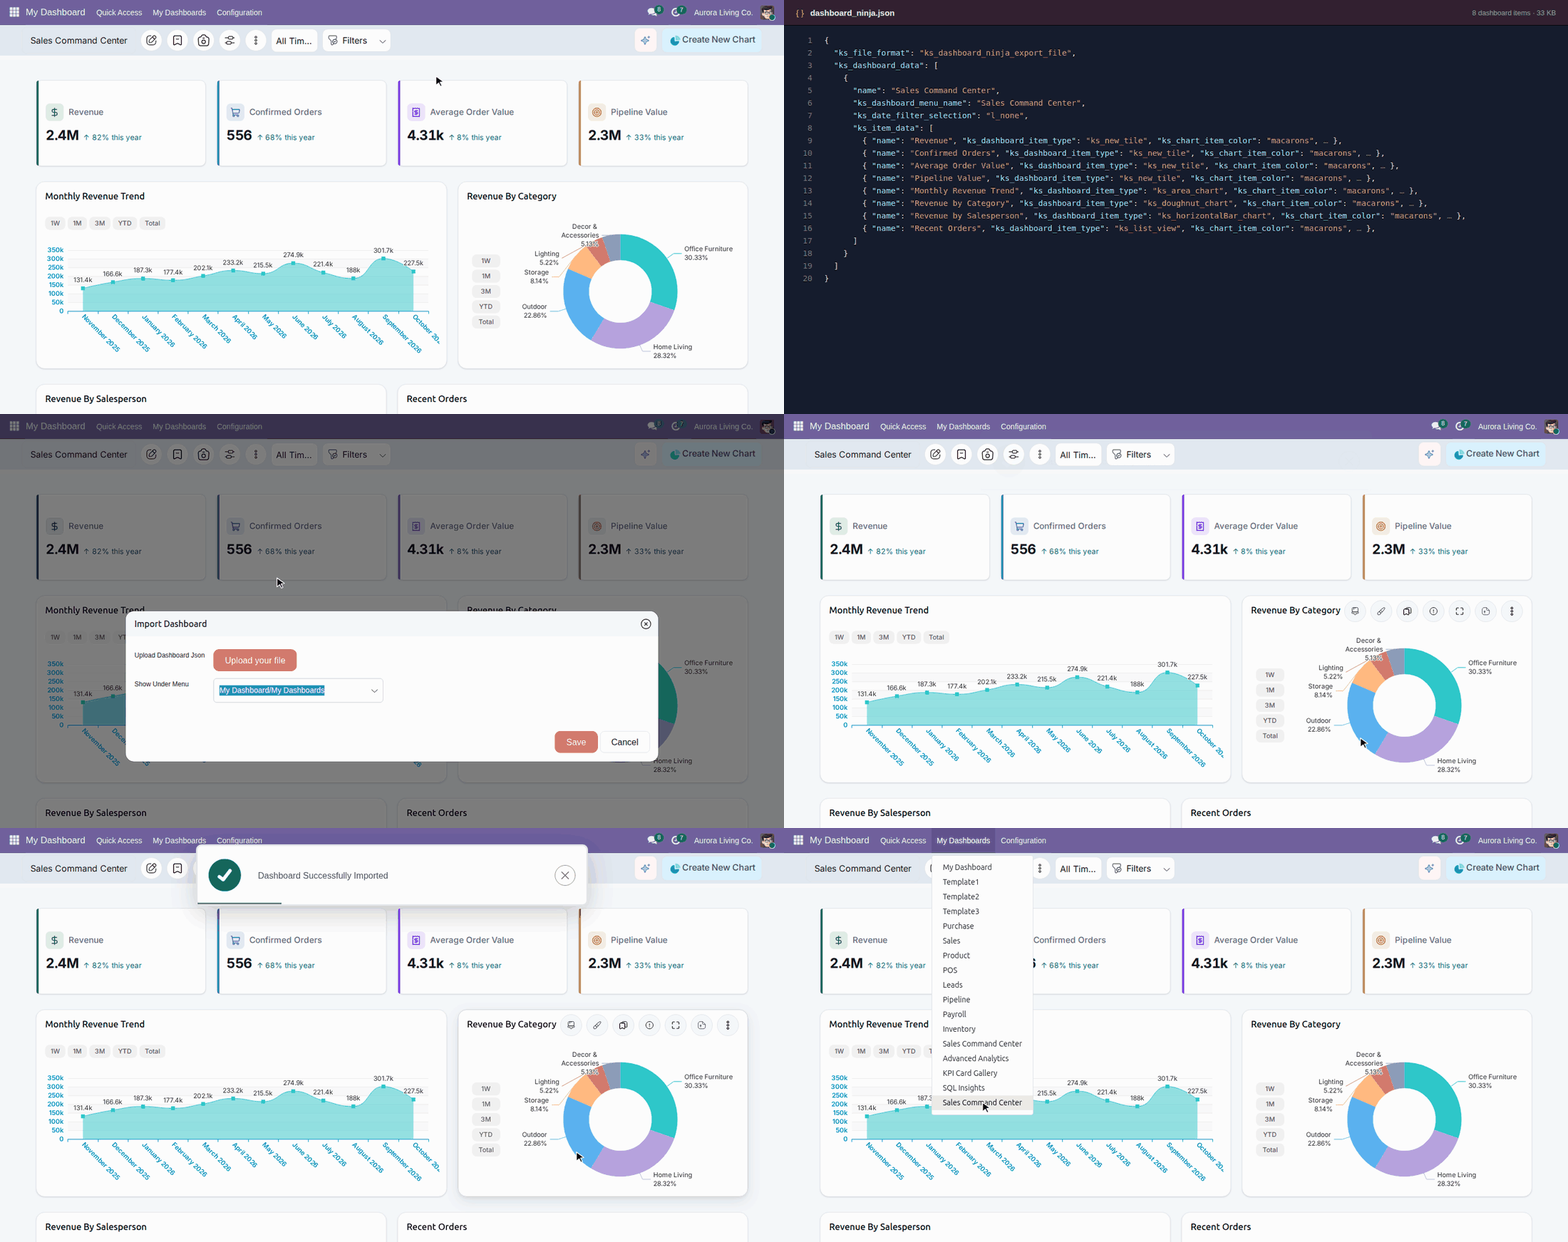
Excel exports now retain numeric values as numbers instead of treating them as text. This makes the exported information more useful for further calculations and analysis. - Improved JSON Export and Import
Dashboard JSON exports and imports now retain additional settings, including three-level charts and list value-bar configurations. - Better Dashboard Capture
The Capture Dashboard functionality now reports failures clearly instead of leaving the screen blocked. - Accurate Dashboard Duplication
Duplicating a dashboard now copies its items and layout exactly, making it easier to reuse existing reporting structures.
Together, these improvements make it easier to take dashboard information beyond the Odoo interface and use it in business reporting workflows.
Also Read: Difference Between Odoo Dashboard and Dashboard Ninja with AI
8. Enjoy a Refreshed Dashboard Experience
Dashboard Ninja 4.0 also introduces several visual and usability improvements. The update focuses on making dashboards cleaner, more consistent, and easier to navigate.
Some important changes include:
- New Inter Font: Dashboards now use the Inter typeface, bundled with the module. This provides consistent typography without requiring an internet connection.
- Refreshed Card Designs: Cleaner borders, softer shadows, and improved spacing create a less crowded dashboard layout.
- Improved Grid Layout: Cards automatically adjust to the available space, and overlapping cards are corrected when the dashboard loads.
- Smarter Chart Labels: Axis labels rotate automatically when needed, while hovering over longer labels displays their complete text.
- 36 Colour Palettes: Users now have more options to customize chart colours and align dashboards with their preferred visual themes.
- Improved Chart Interactions: Clicking a chart displays a contextual menu with relevant actions instead of triggering an unexpected navigation.
- Clear Empty States: When a filter returns no results, charts display a visual no-data indicator.
The release also includes approximately 44 bug fixes and hardening improvements, covering areas such as dashboard manager access errors, safer uninstallation, and correct date grouping.
These changes improve the overall dashboard experience while preserving existing dashboard configurations.
9. What’s New in Advanced Dashboard Ninja 1.1.0?
Alongside Dashboard Ninja 4.0, Advanced Dashboard Ninja receives version 1.1.0. This module extends dashboard capabilities for businesses that need to work with data beyond standard Odoo models or share dashboards through additional reporting formats.
Here are its important capabilities:
-
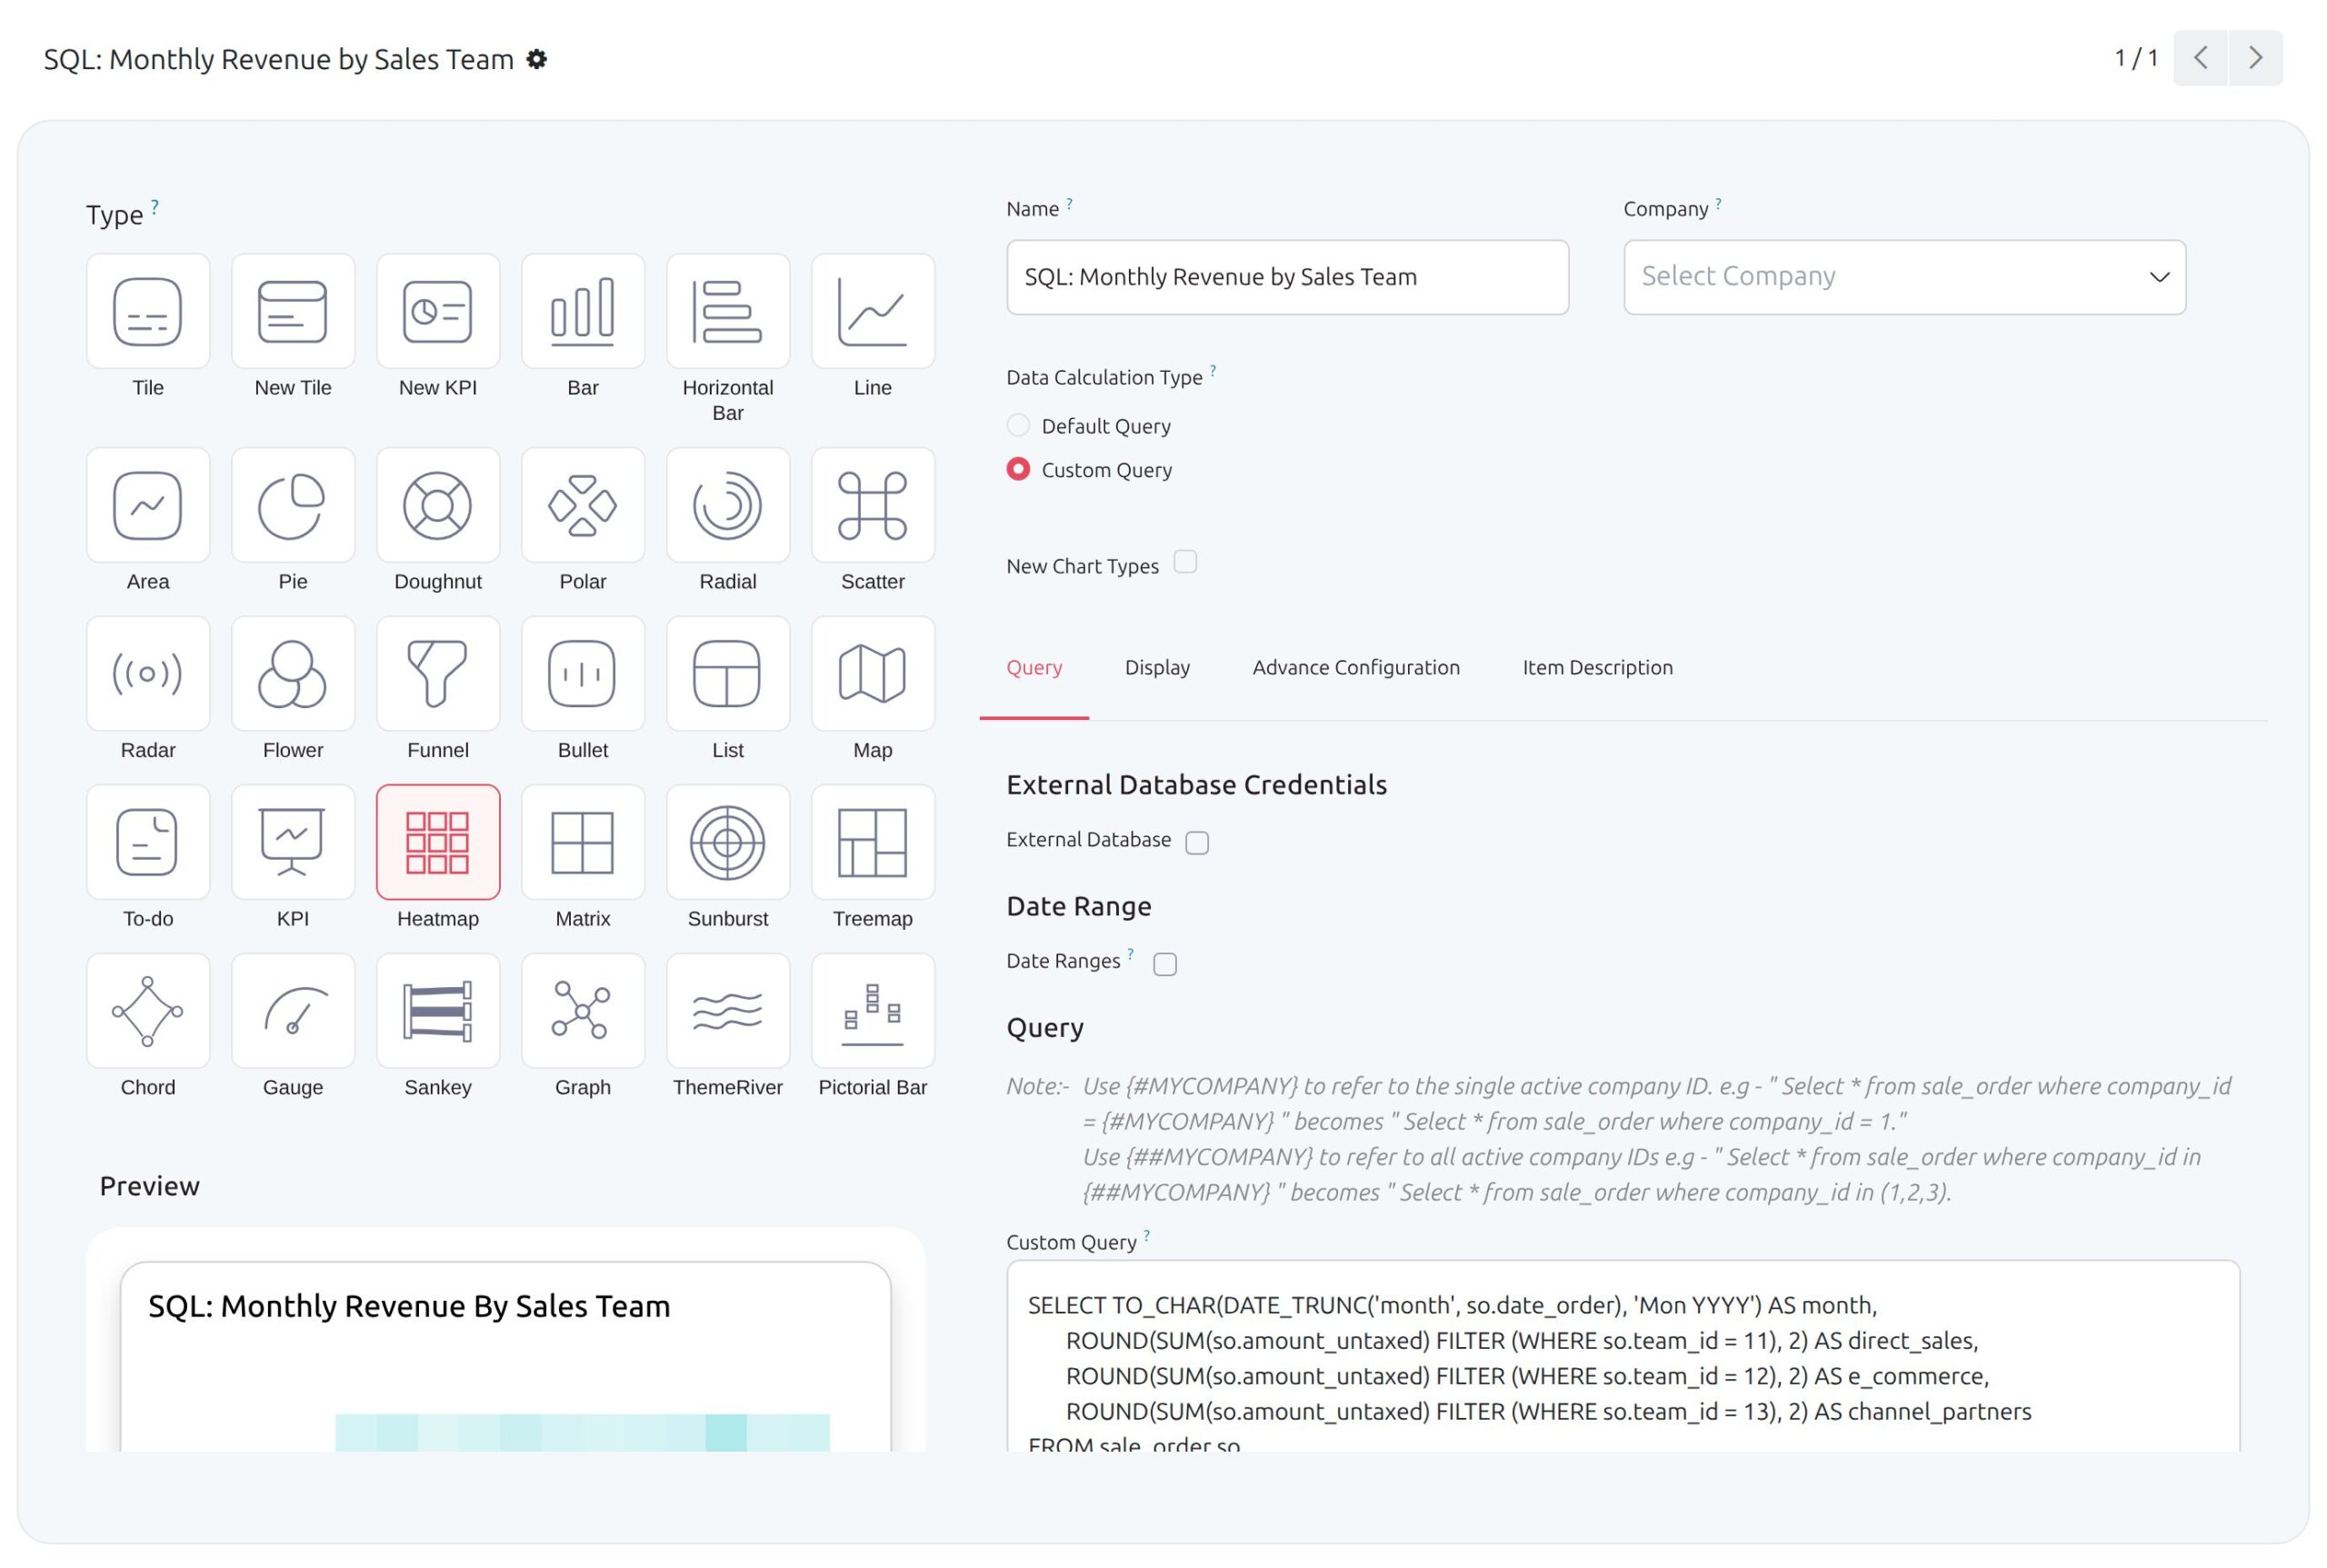
- Expanded Custom SQL Support
Advanced Dashboard Ninja already supported custom SQL queries for several chart types, KPIs, and lists. Version 1.1.0 extends this support to nine additional chart types:- Heatmap
- Matrix
- Sunburst
- Treemap
- Chord
- Gauge
- Sankey
- Graph
- ThemeRiver
This allows users to build more specialized visualizations using custom SQL queries.
- Expanded Custom SQL Support
- External Database Connectivity
Users can execute custom SQL queries against external PostgreSQL and MySQL databases. This is useful for businesses that maintain reporting information in legacy systems, databases, or data warehouses outside Odoo. - External API Integration
Advanced Dashboard Ninja can also retrieve data from an external API URL and display the returned information in a table. This helps businesses bring information from other SaaS applications into their dashboards. - Fixed Query Date Ranges
Users can define specific start and end dates for queries, making it easier to prepare reports for defined reporting periods. - Dashboard Email, PDF, and Print
The module supports sending dashboards as PDF files to selected recipients, including CC recipients. Users can also download or print the entire dashboard as a multi-page PDF. - TV and Carousel Mode
The TV/carousel mode displays dashboard items in a full-screen slideshow. Users can configure playback, pause, and slide intervals. This makes it useful for displaying business metrics on screens across sales floors, shop floors, reception areas, and other workspaces.
10. How Do These Updates Benefit Different Odoo Users?
The new features are useful across different business functions because each team needs to monitor different metrics and reporting requirements. Here’s how Dashboard Ninja 4.0 supports different user roles:
| User Role | Relevant Features | What They Can Monitor |
|---|---|---|
| Business Owners | Trend cards, target-based KPIs, sample dashboards | Revenue, spending, and overall business performance |
| Sales Managers | Sales dashboard, Heatmap, Radial charts, drill-down | Salesperson performance, customer revenue, and sales trends |
| Marketing Managers | Leads dashboard, Funnel charts, drill-down | Lead sources, campaigns, lost reasons, and conversion metrics |
| Purchase Managers | Purchase dashboard, Treemap, KPI cards | Supplier spending, purchase orders, and delivery delays |
| Product Managers | Product dashboard, Heatmap, Treemap | Product sales, category performance, and best-selling products |
| Warehouse Managers | Inventory dashboard, Matrix, KPI cards | Stock movement, receipts, deliveries, and fulfilment rates |
| Retail Managers | POS dashboard, Matrix, Sunburst | Store performance, payment methods, and transaction metrics |
| HR Managers | Payroll dashboard, Matrix, Bullet charts | Department-wise payroll costs and employee metrics |
| Finance and Analysts | Quick filters, custom SQL, Excel exports | Detailed reporting, financial comparisons, and customized analysis |
These examples show how businesses can use the same dashboard platform to address different reporting needs across departments.
11. Upgrading to Dashboard Ninja 4.0 for Odoo 19
Dashboard Ninja 4.0 is designed for Odoo 19 and is available as an upgrade for customers using earlier Dashboard Ninja versions on Odoo 19.
Existing dashboards retain their items and layouts, while charts automatically switch to the new chart engine.
However, there are a few things existing users should know before upgrading:
- Existing Tile and KPI cards retain their original appearance. The new card designs are optional and can be selected individually.
- Older colour palettes are mapped to the new palettes, so some chart colours may change slightly.
- Advanced Dashboard Ninja users must upgrade to version 1.1.0 alongside Dashboard Ninja 4.0.
- The first opening of a sample dashboard takes a few seconds while it builds using the company’s data. Later openings are instant.
- Each sample dashboard requires its corresponding Odoo application. For example, the Payroll dashboard requires Enterprise Payroll.
There are also some functional limitations worth knowing:
- Three-level grouping is available only for Sunburst and Treemap charts. Other charts support two grouping levels.
- The new chart types cannot be used as drill-down levels.
- Custom SQL charts cannot be drilled into or opened through chart interactions.
- The 10 new chart types are available as classic items, not under the New Chart Types option.
- Website dashboards do not yet display the New Tile and New KPI cards.
Understanding these considerations helps businesses plan their upgrade and make better use of the new features.
Final Words
Dashboard Ninja 4.0 brings meaningful improvements to how businesses create, customize, and interact with Odoo dashboards. From 10 new chart types and eight ready-made dashboards to redesigned KPI cards, flexible drill-downs, and improved list views, the release makes business reporting more accessible and interactive. Users can spend less time configuring reports and more time understanding the information behind their business performance.
Whether you want to monitor sales, analyze purchase trends, track inventory, or present performance metrics to management, Dashboard Ninja with AI provides a flexible way to visualize your Odoo data. Explore the latest Dashboard Ninja 4.0 features for Odoo 19 and make your business reporting more informative and easier to manage.