


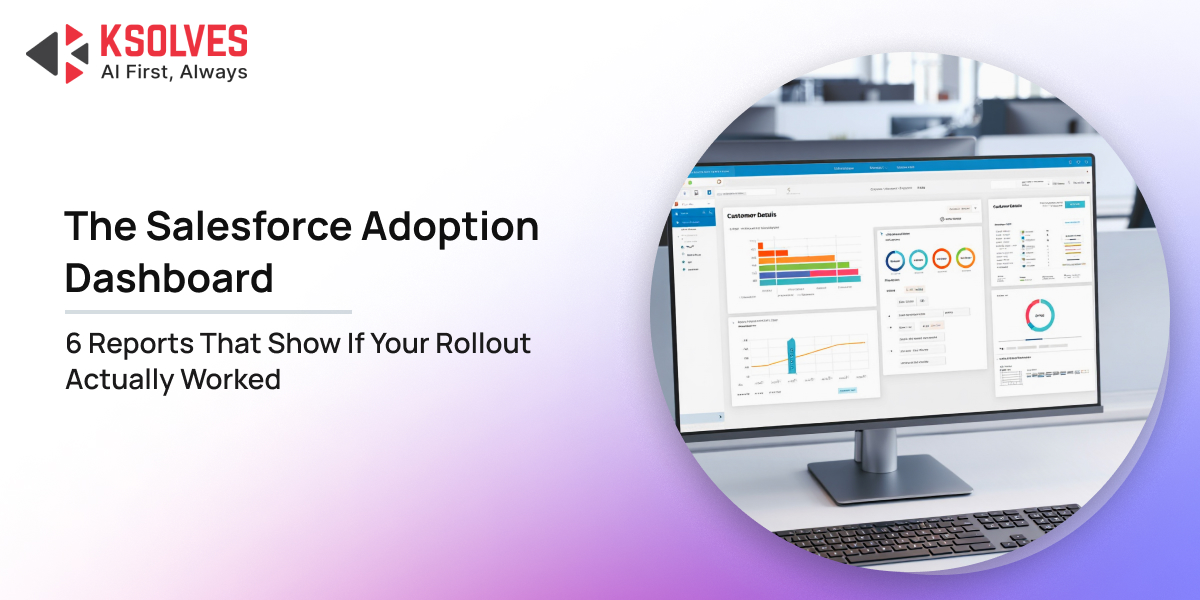
The Salesforce Adoption Dashboard: 6 Reports That Show If Your Rollout Actually Worked
Salesforce
5 MIN READ
October 16, 2026

The CRM is live, but sales managers are still asking for Excel pipeline reports, representatives are skipping opportunity updates, and leadership is questioning the numbers. That is when a Salesforce rollout needs to be measured by more than a successful go-live.
The pressure is increasing as CRM platforms become central to AI-led sales operations. Salesforce’s 2026 State of Sales research found that 87% of sales organizations are using AI, while 54% of sellers have already used AI agents, and nearly 90% expect to use them by 2027. But AI and automation can only deliver value when teams consistently use the CRM and maintain reliable data.
A high login rate alone does not prove adoption. A representative can log in every day while leaving opportunities outdated, skipping activities, or managing key information in spreadsheets.
That is why an effective Salesforce adoption dashboard should connect user activity, data quality, process usage, feature engagement, reporting behavior, and business outcomes.
Salesforce’s own guidance recommends tracking indicators such as logins, record creation, record updates, completed activities, and opportunity creation rather than relying on a single usage metric.
For decision-makers, the real test is straightforward: Did Salesforce change how the business operates, or did the rollout simply add another system?
These six reports provide the evidence.
1. User Login and Activity Report: Are Teams Actually Using Salesforce?
Start with the most basic question: Who is using Salesforce, how often, and in what way?
A user activity report should show more than total logins. Break usage down by department, role, region, and time period. Look at weekly active users, users who have not logged in recently, sessions, and the actions users perform after logging in.
Salesforce specifically recommends login rates and record creation or updates as early indicators of adoption.
For example, imagine a company has 250 sales users and reports a 92% login rate. On the surface, that looks healthy. But a deeper report shows that 40% of those users only log in on Monday morning before the sales meeting and make no meaningful record updates during the rest of the week.
That changes the diagnosis. The organization does not have a login problem. It has a workflow adoption problem.
A useful dashboard should therefore answer:
- Which teams are active?
- Which roles have declining activity?
- How many users have not logged in during the last 7 or 30 days?
- Are users creating and updating the records relevant to their jobs?
- Which Salesforce features are actually being used?
This is one of the most important Salesforce adoption metrics because it establishes whether the platform has become part of everyday work rather than a system employees visit only when management asks.
2. Record Creation and Data Completeness Report: Is Salesforce Becoming the System of Record?
Usage without useful data is not adoption. The second report should examine whether users are creating, updating, and completing the records that support business processes. This includes Accounts, Contacts, Leads, Opportunities, Cases, activities, and relevant custom objects.
Look at both record volume and record quality.
Suppose a sales team created 1,200 opportunities during a quarter. That sounds productive until the report shows that 35% have no next step, 22% have outdated close dates, and many are missing important qualification information.
The CRM is being used, but it is not producing dependable pipeline data.
This is where Salesforce user adoption needs to be measured alongside data quality. A mature adoption dashboard should track fields that matter to business decisions, not simply the number of records created.
Useful indicators include:
- Opportunity records updated within the last 30 days
- Accounts without recent activity
- Opportunities missing next steps
- Records with incomplete key fields
- Duplicate records
- Leads without follow-up activity
- Opportunities with past close dates
WalkMe’s research on adoption measurement similarly recommends tracking record creation, updates, field completion, opportunity activity, and other data-quality indicators.
For leadership, this report answers an important question: Can we trust Salesforce as the operational source of truth?
3. Sales Process Adoption Report: Are Teams Following the New Workflow?
A CRM rollout is designed to improve a business process, not simply move existing information into a new system. The adoption dashboard should therefore show whether sales teams are actually following the workflows Salesforce was configured to support.
For a sales organization, the report can track the complete journey: Lead → Qualification → Opportunity → Proposal → Negotiation → Closed Won
Key indicators to monitor include:
- Stage progression: How many records move from one stage to the next?
- Time in stage: How long do opportunities remain at each stage?
- Process drop-offs: Where are records regularly getting stuck?
- Stage bypasses: Are users skipping required stages or moving opportunities forward without completing key steps?
- Required-field completion: Are critical qualification fields being completed?
Consider a B2B company that introduced a qualification process requiring sales representatives to capture industry, estimated budget, buying timeline, and decision-maker information before converting a lead. Three months after launch, management finds that representatives are converting leads with half of these fields blank.
Salesforce service should therefore measure whether the configured sales process is being followed effectively, not just whether users are active in the CRM.
4. Feature and Automation Usage Report: Are Teams Using What You Paid For?
Many Salesforce implementations introduce features that require significant investment: automation, dashboards, approval workflows, forecasting, mobile capabilities, integrations, and AI features.
But deployment does not equal usage. This report should compare available capabilities with actual usage.
For example, a company may spend months implementing automated lead assignment. The workflow automatically routes new leads based on geography, product interest, and sales territory.
Six months later, an audit reveals that sales operations still manually assigns 60% of leads because the underlying territory data is incomplete.
The automation exists. The business case does not. Similarly, an organization may launch advanced forecasting dashboards while regional sales managers continue using Excel because they do not trust the underlying opportunity data.
Salesforce provides user behavior and adoption analytics that can show which applications and objects users engage with and where they encounter friction. Some of these capabilities require Salesforce Shield or event monitoring.
For leadership, this report helps answer: Are we getting value from the Salesforce capabilities we funded?
It also provides a practical way to prioritize training. If 90% of users use core opportunity management but only 18% use a recently introduced forecasting feature, the organization can investigate why before investing in another feature.
5. Report and Dashboard Usage Report: Do Managers Trust Salesforce Data?
One of the clearest signs of successful CRM adoption is when managers actually use CRM data to run the business. A dashboard usage report should track which reports and dashboards are viewed, by whom, and how frequently.
For example, a regional sales director may have access to a pipeline dashboard showing:
- Open pipeline value
- Pipeline by stage
- Win rate
- Average deal size
- Opportunities closing this quarter
- Stalled opportunities
If the dashboard is rarely accessed and the director requests an Excel report before every leadership meeting, the problem is not dashboard availability. It is confidence and usability.
Perhaps the pipeline data is incomplete. Perhaps the definitions of “qualified opportunity” and “forecast” differ between Salesforce and finance. Or perhaps the dashboard simply does not answer the questions leaders need answered.
This report should therefore be paired with stakeholder feedback. The goal is to determine whether Salesforce has become part of management decision-making.
6. Business Outcome Report: Did the Rollout Actually Improve Performance?
This is the report that matters most to the executive team. After measuring activity, data quality, process usage, feature engagement, and reporting behavior, connect adoption to business outcomes. The exact metrics depend on the original business case.
|
Business Area |
Key Outcome Metrics |
| Sales |
Lead conversion rate, opportunity win rate, sales cycle length, pipeline coverage, forecast accuracy, revenue per representative |
|
Customer Service |
First-response time, case resolution time, cases handled per agent, escalation rate, customer satisfaction |
| Marketing |
Lead response time, campaign contribution, MQL conversion rate, cost per qualified lead |
Consider a company that launched Salesforce to improve lead management. Before implementation, average lead follow-up took three days. Six months later, Salesforce reports show that 80% of new leads receive a documented follow-up within one business day, while conversion from qualified lead to opportunity has increased.
Now leadership can connect the technology investment to an operational result. That is the difference between measuring usage and measuring value.
Implementing Your Adoption Dashboard: Action Plan for Decision Makers
Building an effective adoption dashboard doesn’t require complex custom code or expensive add-ons. Follow this four-step implementation blueprint to deploy these metrics across your organization:
- Use Free Pre-Built Assets: Install the free Salesforce Adoption Dashboards package from the Salesforce AppExchange. This package provides over 40 pre-built reports and 3 core dashboards tracking user logins, key feature usage, and record creation patterns.
- Customize Key Performance Thresholds: Tailor the default report filters to match your business rules. Define specific activity thresholds (e.g., minimum 5 logged tasks per week, maximum 30 days without activity on open deals) that reflect operational expectations.
- Embed Metrics Into Operational Cadences: Tie dashboard visibility directly into team routines. Schedule automated weekly email summaries of the Adoption Dashboard to sales directors and regional managers.
- Address Friction With Targeted Support: Use dashboard insights to guide ongoing enablement. Rather than forcing the entire company through repetitive, broad-based training, deliver concise, role-specific coaching to teams showing lower adoption scores.
This is where a practical CRM adoption strategy becomes important. Instead of asking whether adoption is “good” or “bad,” leadership can identify exactly where behavior is breaking down and assign corrective action to the right team.
Salesforce recommends reviewing adoption metrics regularly and using changes in usage patterns as signals for additional assistance or training.
Build the Adoption Dashboard Around Business Questions
The best adoption dashboard is the one that helps leadership make decisions quickly. A useful executive dashboard can organize the six reports around five questions:
Are people using Salesforce?
Look at logins, active users, sessions, and activity.
Are they entering reliable data?
Review record creation, updates, completeness, duplicates, and stale records.
Are they following the intended processes?
Track stage movement, required activities, approvals, and workflow completion.
Are managers using Salesforce to run the business?
Measure report and dashboard engagement.
Is the investment producing results?
Connect adoption data with revenue, productivity, service, marketing, or operational outcomes.
This approach also makes it easier to compare adoption across regions and roles. A sales representative, service agent, marketing manager, and executive sponsor should not be expected to demonstrate adoption in exactly the same way.
From Go-Live to Measurable Salesforce Value
A successful Salesforce rollout is defined by whether people use it, whether the data can be trusted, whether the intended processes are being followed, whether leaders rely on its information, and whether the organization achieves the business outcomes that justified the investment.
Salesforce itself provides adoption dashboards and guidance built around user behavior, record usage, sales and marketing data, and business outcomes.
For decision-makers, that creates a much clearer way to assess the investment. Instead of asking, “Has everyone been trained?” ask, “Has Salesforce changed the way our teams work, and can the data prove it?” That is the real test of adoption.
Final Thoughts
The most valuable adoption dashboard is not a collection of vanity metrics. It is an early-warning and decision-making system.
For organizations preparing a new deployment, these reports should be defined before launch and included in the Salesforce rollout plan from the beginning. For organizations that already live, they provide a practical way to identify adoption gaps and prioritize improvement.
Ksolves helps organizations improve Salesforce implementation, adoption, optimization, and long-term platform performance. Our Salesforce experts can assess user behavior, data quality, workflows, automation, reporting, integrations, and business outcomes to identify where your CRM investment can deliver greater value.
Whether the challenge is low Salesforce user adoption, inconsistent data, underused Salesforce features, or dashboards that leadership does not trust, Ksolves can help turn adoption data into an actionable improvement roadmap.
Explore Salesforce Implementation Services and build an adoption-focused Salesforce environment designed around measurable business outcomes.
FAQs
1. What should a Salesforce adoption dashboard measure?
It should measure user activity, record creation and completeness, process usage, feature engagement, report and dashboard usage, and business outcomes.
2. Which Salesforce adoption metrics matter most to executives?
Login activity alone is not enough. Executives should focus on data quality, process adoption, reporting usage, productivity, pipeline performance, and measurable business outcomes.
3. How often should Salesforce adoption be reviewed?
A monthly review is a practical baseline, with more frequent monitoring during the first few months after launch or after major process changes. Salesforce also recommends regular review of adoption trends.
4. What is the difference between Salesforce usage and Salesforce adoption?
Usage shows whether people interact with the platform. Adoption goes further by showing whether Salesforce has become part of everyday workflows and is producing the intended business results.
5. How can Ksolves improve Salesforce adoption?
Ksolves can assess adoption gaps across users, data, workflows, automation, reporting, integrations, and business outcomes, then recommend targeted improvements, training, optimization, and implementation changes.



























AUTHOR
Salesforce
Rakesh Kumar is a Salesforce Practice Lead and Application Architect at Ksolves India Limited, with over 11 years of experience in Salesforce development and enterprise solution architecture. He specializes in Salesforce Financial Services Cloud, Consumer Goods Cloud, Sales Cloud, Service Cloud, Commerce Cloud, Revenue Cloud, Data Cloud, and Agentforce. His expertise includes designing multi-cloud CRM solutions, integrating enterprise systems, developing reusable Salesforce accelerators, and implementing AI-driven workflows. A 12-time Salesforce-certified professional, Rakesh focuses on enterprise architecture, secure AI agent deployment, and transforming complex business processes into scalable, production-ready Salesforce solutions.
Share with