



Salesforce AI Debugging: How We Went From 4-Hour Fixes to 4-Minute Diagnoses
Salesforce
5 MIN READ
July 28, 2026

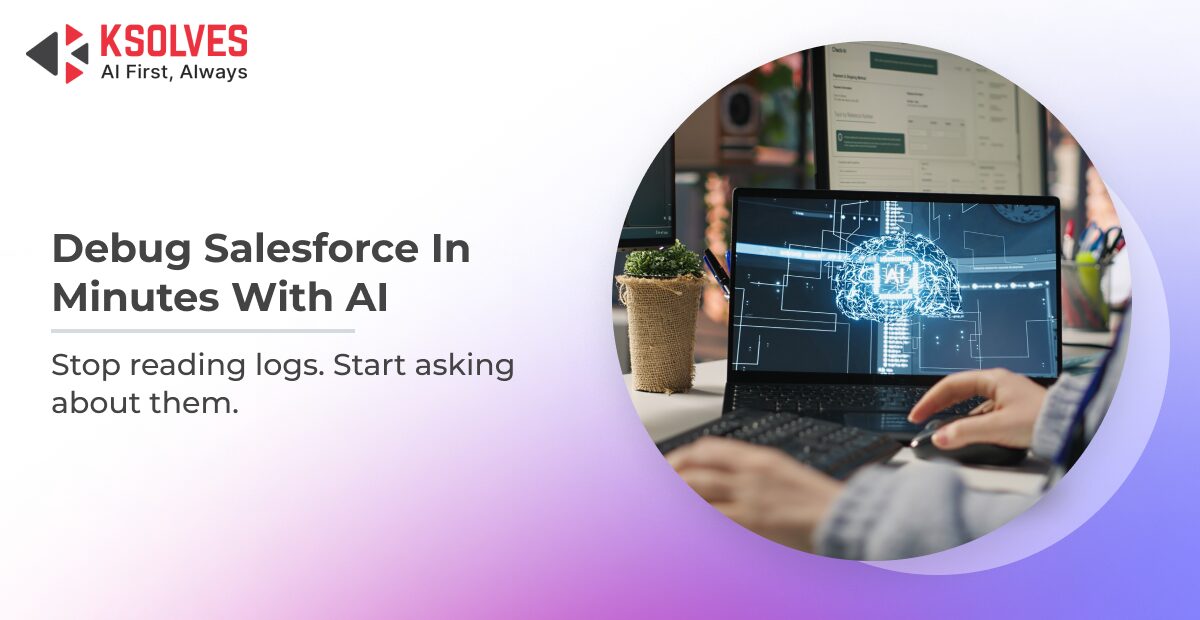
Every Salesforce team has lived this Monday morning. You open your org and notice a wall of errors in the debug logs. A Friday-night deployment broke something in production. A developer opens the log, scrolls through 3,000 lines of noise, and spends the next four hours tracing a single null pointer back to a misconfigured flow that triggered an Apex class that called an integration that failed silently.
Four hours consumed by one bug. Multiply that across a team of ten developers handling production incidents weekly. You are looking at hundreds of billable engineering hours per quarter spent on log forensics.
We’ve been through it all. But after we adopted Salesforce AI debugging, we’ve been handling bugs and errors far more efficiently than before.
The Problem: Salesforce Debugging Was Designed for Patience, Not Speed
Salesforce debug logs are powerful, but they were never designed for fast root cause analysis. They capture every database operation, every method entry and exit, and every governor limit check. That completeness is also the problem. When something breaks in production, you are not looking for a needle in a haystack that is on fire.
The typical debugging session in an enterprise org looks like this:
- Pull the debug log from Setup or Developer Console
- Manually scan for ERROR or FATAL lines buried inside thousands of entries
- Identify the class and line number that tells you what broke, not why
- Cross-reference with deployment history to figure out what changed
- Reproduce the issue in a sandbox, which may or may not behave the same way
- Write a fix, test it, and hope you found the right root cause
Salesforce tooling simply was not built for speed, and at enterprise scale, that gap compounds.
The Shift to Salesforce AI Debugging: Stop Reading Logs. Start Asking About Them
The change we made sounds simple in hindsight. Now we don’t make the developer read the debug log. We hand the log to AI and ask it to explain what went wrong.
We built a workflow where the raw Salesforce debug log is passed to Claude with a structured prompt asking three specific questions:
- What is the primary error, and where exactly did it originate?
- What chain of events led to this error — flows, triggers, classes, integrations?
- What is the most likely root cause, and what should we check first?
The output is a structured diagnosis. We get the root cause first, then supporting evidence, and, finally, the investigation path.
Struggling With Slow Salesforce Debugging?
What Our Salesforce AI Debugging Looks Like in Practice
Let’s elaborate with a real example. A production error surfaced in our org — an Apex trigger failing intermittently on Account updates. The error message was generic:
System.NullPointerException: Attempt to de-reference a null object.When we weren’t using AI, our developer spent three and a half hours pulling logs from multiple failed transactions, cross-referencing recent deployments, isolating the trigger, and eventually tracing the null reference to a custom metadata record deleted during an unrelated cleanup task.
Now, the debug log goes to AI. Within four minutes, we get a structured output that identifies the specific line in the trigger, notes that the custom metadata query was returning null because the referenced record no longer existed, flags the deletion date, and suggests adding a null check with a fallback value as the fix.
Earlier, it would have taken us three and a half hours to catch the error. With AI, we caught it in four minutes. We have a fix in production before the incident escalates to account teams.
Why AI Debugging Works Especially Well for Salesforce
Salesforce errors are tricky. In an enterprise org, a single user action can trigger a cascade: a record update fires a flow, the flow calls an Apex method, the method makes a callout to an ERP, the callout fails, and the failure rolls back a transaction that also affected a completely unrelated process. The log captures all of it, but a human has to mentally reconstruct the sequence. This kind of autonomous, multi-step reasoning is part of a broader shift toward agentic AI handling technical tasks end to end.
AI is exceptionally good at exactly this kind of pattern reconstruction. It reads the full execution sequence, identifies the causal chain, and surfaces the origin point. AI’s ability to answer the “why” behind the error is everything in Salesforce debugging.
Three reasons are behind AI’s exceptional use case in Salesforce errors:
1. Governor Limits Add Noise
Salesforce logs are full of limit-usage entries that are rarely the actual problem. AI filters them out automatically and focuses on the execution path that mattered.
2. Multi-Layer Architecture
Flows, Process Builders, Apex, managed packages, and external integrations all interact. Enterprise orgs run all of them at once. AI reads across every layer in a single pass, while a human has to jump between tools.
3. Error Messages Are Misleading
A null pointer exception in Apex is often caused by something three steps earlier in the execution. AI traces the full chain to get to the root cause. Many of these misleading traces connect back to high-impact bug patterns in Salesforce custom objects that recur across enterprise orgs.
The Enterprise Impact: MTTR, Team Leverage, and Governance
The change from using AI to debug Salesforce errors has been tangible across metrics significant for engineering leadership.
Faster Resolution and Protected SLAs
Average time from error report to confirmed root cause dropped from 3-4 hours to under 10 minutes in most cases. For customer-facing processes bound by SLAs, that difference is the gap between an internal ticket and a contractual breach.
Junior Developers Operate at Senior Level
Debugging Salesforce logs used to require years of pattern recognition. Now a junior developer with a well-structured prompt can diagnose the same issue a senior developer would. This is a direct hiring and retention lever for enterprises facing Salesforce talent shortages and long onboarding times.
Less Context-Switching and More Delivery
Developers are no longer spending half their day inside debug logs. That reclaimed focus time compounds across sprints and shows up in roadmap velocity.
Audit-Ready Post-Mortems
Every significant error now produces a structured, AI-generated root cause diagnosis. Post-mortems and incident reviews are based on documented analysis, not reconstructed memory. It’s a meaningful improvement for organizations with compliance and change-management requirements.
Best Practices to Scale Salesforce AI Debugging Across Your Enterprise
If your teams are managing multiple orgs, managed packages, and integration-heavy landscapes, consider scaling Salesforce AI debugging with these best practices.
Standardize the Prompt
Treat the diagnostic prompt like shared infrastructure. A version-controlled, team-wide prompt template ensures every developer gets diagnosis-quality output, not summaries. Standardizing the diagnostic prompt works best when it’s paired with a solid Salesforce implementation roadmap across your org.
Route by Complexity
Simple errors with obvious messages do not need AI analysis. Reserve the workflow for complex multi-layer failures, such as flows triggering Apex triggering integrations. Here, the time savings are dramatic.
Keep Humans in the Loop
AI does not replace understanding your org. It accelerates getting to the right question. You still need a developer who knows your Salesforce architecture to evaluate the diagnosis and implement the fix.
Prove It with Your Worst Incidents
Take the three most painful debugging sessions from your last sprint and run them through the workflow. The time delta will make the business case better than any article will.
Takeaway for Engineering Leaders
Debugging is not where senior developer expertise should be spent. Diagnosing root causes in 3,000-line logs is not a high-value use of an experienced Salesforce engineer’s time, or your budget. Building, designing, and solving harder problems is.
Debugging gaps are often a symptom of a bigger pattern — the same root causes behind why Salesforce implementations fail in the first place. Salesforce AI debugging does not make errors disappear. But the gap between “something broke” and “here is exactly why and how to fix it” no longer has to be measured in hours and burned sprint capacity.
For our team, the shift from 4 hours to 4 minutes changed how developers feel about Monday-morning production errors. It changed how leadership thinks about the operating cost of the platform.
If your organization is still reading Salesforce debug logs line by line, you are spending enterprise engineering time on a problem that no longer requires it.
Build Your QA Matrix
Frequently Asked Questions
What is Salesforce AI debugging?
Salesforce AI debugging is the practice of feeding raw Salesforce debug logs to an AI model and asking it to identify the root cause, instead of manually scanning thousands of log lines. Ksolves uses this approach to turn a multi-hour log review into a structured diagnosis in minutes.
What happens if Salesforce debugging issues go unresolved for too long?
Unresolved Salesforce errors compound production risk — SLA breaches on customer-facing processes like order management or onboarding, mounting billable engineering hours, and repeat incidents traced to the same misconfigured flows or Apex classes. Left unaddressed for a quarter, teams can lose hundreds of engineering hours to repetitive log forensics.
How do you set up AI-based Salesforce debugging?
Set up AI Salesforce debugging by feeding a debug log to an AI model with a structured prompt asking for the primary error, the chain of events that caused it, and the most likely root cause. Ksolves recommends version-controlling this prompt as shared infrastructure so every developer gets consistent, diagnosis-quality output.
Is AI debugging better than manual Salesforce log review?
For complex, multi-layer failures spanning flows, Apex, and integrations, AI debugging is significantly faster than manual review — cutting average root-cause time from 3-4 hours to under 10 minutes in most cases. Simple errors with clear messages usually don’t need AI and can still be resolved manually.
When should a Salesforce team use AI to debug production errors?
AI debugging delivers the most value on complex, multi-layer failures — cases where a flow triggers Apex, which calls an integration, which then fails silently. Ksolves recommends reserving it for these harder incidents rather than routing every minor error through the workflow.
Who can implement AI-powered Salesforce debugging for an enterprise org?
Enterprise Salesforce teams can implement AI-powered debugging in-house with a standardized prompt template, or work with a Salesforce consulting partner like Ksolves to build and scale the workflow across multiple orgs and managed packages.
Have a debugging bottleneck slowing your team down? Contact our team.
































Author
About the Author Editorial Team The Ksolves Editorial Team includes certified Salesforce experts, Big Data engineers, AI/ML specialists, Zoho consultants, and experienced technology writers focused on delivering clear, actionable insights for modern businesses. With hands-on experience across Salesforce, Big Data platforms, AI/ML solutions, application development, software testing, and Zoho ERP/CRM, the team publishes practical guides, real-world use cases, and industry updates that support smarter decisions and faster growth. Every article is created to solve business challenges, guide technology adoption, and keep organizations aligned with evolving digital ecosystems.
Share with